
A big red candle closes the session near its low. The next day gaps down further — sellers look in control. Then buyers step in. Price climbs all day and closes above the midpoint of yesterday's body. Not above the open. Just past the halfway mark.
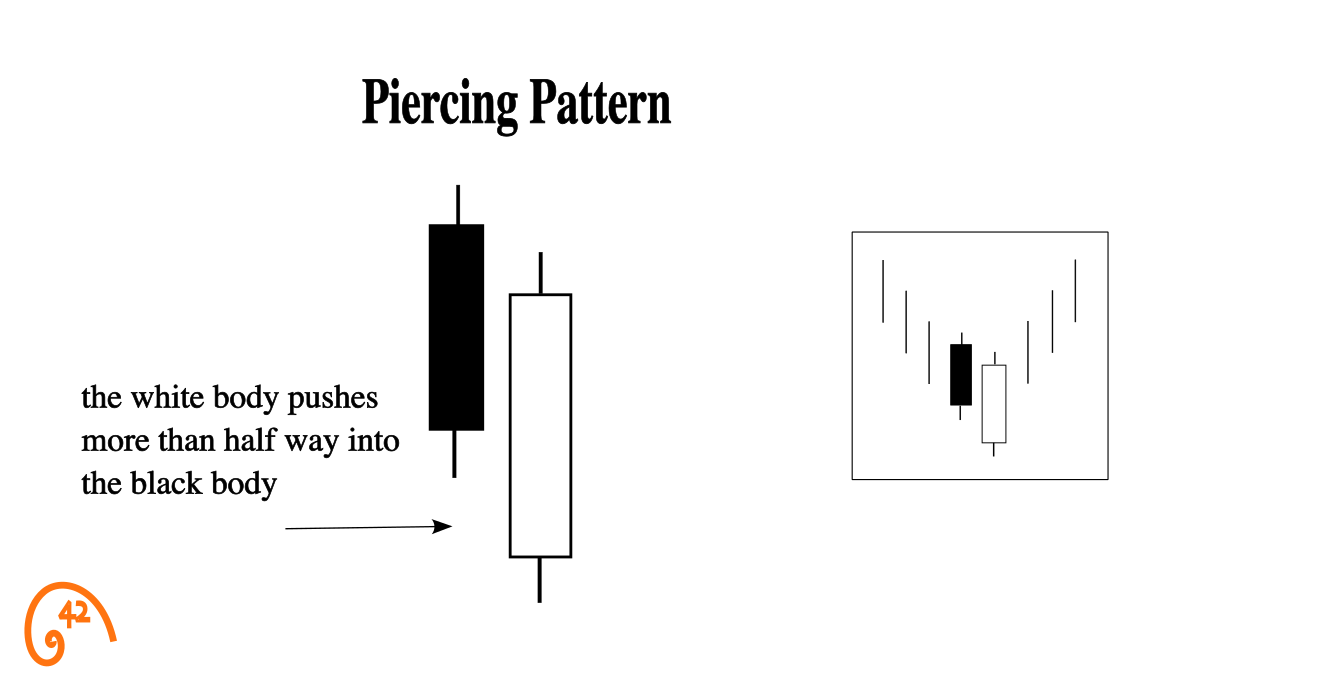
That's a Piercing Pattern.
The rule is the whole pattern: the close must be above the midpoint of the prior red body. Partial recovery, partial victory — and often that's enough. Reading a reversal that's implied instead of shouted is where real chart-reading starts.
You don't need to conquer the hill. You just need to prove you can climb it. That's the Piercing Pattern.
What Makes a Piercing Pattern
The Piercing Pattern is a two-candle bullish reversal signal that appears after a downtrend. The first candle is a strong bearish session — sellers are in control. The second candle gaps down at the open (below the prior low), then rallies hard and closes above the midpoint of the first candle's body — but below its open.
That partial recovery is what defines the pattern. It's not a full reversal — it's a statement: sellers had every advantage (the gap down, the momentum, the trend), and they still couldn't hold the low. Buyers reclaimed more than half the prior session's losses in a single candle.
How a Piercing Pattern Forms
Every two-candle pattern is a compressed story told across two sessions. The Piercing Pattern's story is about overreach — sellers pushed too hard, and buyers called the bluff.
"Another heavy red day. The trend is intact. No reason to step in."
The first candle is a strong bearish session — a large red body with sellers in control from open to close. It confirms the existing downtrend and discourages any buyers from stepping in. This is the setup candle.
"It gapped below yesterday's low. This thing is in free fall."
The second session opens below the first candle's low — a gap down. Sellers pushed price even lower overnight. At the open, everything looks like the decline is accelerating. This is where most traders see weakness and either sell or stay away.
"Wait — it's climbing. They gapped it down and buyers are taking it back."
Throughout the session, buyers absorb the selling and push price higher. By the close, the second candle has recovered more than half of the first candle's body. The gap down that looked like capitulation turned into a springboard. Sellers overplayed their hand.
Here's the key insight: the Piercing Pattern doesn't prove buyers have taken over. It proves sellers couldn't hold their best position. They had the trend, the momentum, and the gap — and they still gave back more than half. That's meaningful.
Whether that crack turns into a full reversal depends on what happens next. But the shift in intraday control — from gap-down panic to close-above-midpoint recovery — is the kind of behavior that precedes turning points.
The Midpoint Rule
The midpoint rule is what separates a Piercing Pattern from a weak bounce. Here's exactly how it works.
Take the first candle's open (the top of the bearish body) and its close (the bottom of the bearish body). The midpoint is the average of those two prices:
Midpoint = (First candle open + First candle close) / 2
For the pattern to qualify as a Piercing Pattern, the second candle must close above this midpoint. If it closes below the midpoint, the recovery wasn't strong enough — buyers didn't reclaim enough ground to matter.
Why does the midpoint matter? Because it represents the psychological halfway point of the prior session's selling. When buyers push the close above it, they've erased more than half of the prior bearish conviction. That's the threshold where the recovery shifts from "dead cat bounce" to "something may be changing."
The closer the second candle's close gets to the first candle's open — without exceeding it — the stronger the signal. A close just barely above the midpoint is the minimum qualification. A close near (but below) the prior open is almost an Engulfing, and carries more weight.
Piercing Pattern vs. Dark Cloud Cover
The Piercing Pattern has a direct bearish counterpart: the Dark Cloud Cover. Same mechanics, opposite direction. If you understand one, you already understand the other.
- Appears after a downtrend
- Gap down, close above the midpoint of the prior bearish body
- Signals buyers reclaimed more than half — potential bottom
- Appears after an uptrend
- Gap up, close below the midpoint of the prior bullish body
- Signals sellers reclaimed more than half — potential top
The midpoint rule is the same in both: the second candle's close must cross the halfway point of the prior body to qualify. The gap (down for Piercing, up for Dark Cloud) is what makes the recovery meaningful — without it, the second candle is just an ordinary session in the opposite direction.
How to Trade the Piercing Pattern
The Piercing Pattern is a partial signal — the recovery is real but incomplete. That asymmetry demands more confirmation than a clean reversal does. Here's how to approach it systematically.
Confirm the downtrend is real
The Piercing Pattern only matters after a sustained decline — multiple sessions of lower highs and lower lows. A Piercing Pattern after a two-day dip in a range is noise. You need genuine bearish momentum for the pattern to reverse.
Verify the midpoint rule
Calculate the midpoint of the first candle's body: (open + close) / 2. Confirm the second candle's close is above that level. If it's below, the pattern doesn't qualify — the recovery wasn't strong enough. This is a hard requirement, not a suggestion.
Check for structural support
The strongest Piercing Patterns form at levels where buyers have reason to show up: prior support zones, moving averages, Fibonacci retracement levels. A Piercing Pattern in open space is much less reliable than one at a level the market has respected before.
Wait for confirmation
Because the Piercing Pattern is partial — the second candle doesn't fully engulf — confirmation matters more here than with stronger patterns. Wait for the next session to close above the second candle's high. That follow-through proves the recovery has legs.
Define your stop
The natural stop is below the second candle's low (the gap-down low). If price breaks below the point where buyers launched the recovery, the pattern has failed. Set this before you enter, not after.
A stock gaps down 2% at the open after a 3-week decline. During the session, buyers push the price up aggressively. By the close, the candle has recovered to close exactly at the midpoint of yesterday's bearish candle — right on the line. Volume is above average.
Is this a valid Piercing Pattern, and would you trade it?
Reading the Piercing Pattern in Context
Three lenses decide whether a Piercing Pattern is a signal or just noise: volume, structure, and momentum. Each gets its own dedicated guide; this is the quick orientation.
Volume — was the recovery fought or drifted into? The session opens on heavy selling — the gap down looks like capitulation. Then volume picks up on the buy side as price climbs back above the midpoint. That mid-session handoff is what separates a real Piercing Pattern from a quiet drift higher. Candlesticks + Volume guide →
Structure — where on the chart did it form? A midpoint close that also reclaims a moving average, a prior support zone, or a Fibonacci retracement carries far more weight than a midpoint close in open space. The pattern shows buyers reclaimed more than half in one session. Structure tells you why they showed up where they did. Candlesticks + Moving Averages guide →
Momentum — was the dominant side stretched or just resting? Check RSI heading into the pattern. A reading near or below 30 means sellers were already exhausted — the recovery has a real chance of marking a turn rather than a pause. If RSI is mid-range, the decline still has room to run, and the Piercing Pattern is more likely a temporary reaction than a reversal. Candlesticks + RSI guide →
Pattern tells me where to look, context tells me whether to act.
Seeing the Piercing Pattern in Action: $EW
Here's a Piercing Pattern that printed at the bottom of a multi-week slide — exactly the kind of context the pattern needs to mean something.

Before the Piercing Pattern. Edwards Lifesciences ($EW) had been sliding from late May into late June 2025. From around $78 the stock ground steadily lower — session after session of lower highs and lower lows, with no meaningful bounces. By the end of June, price was sitting near $73, a level that had acted as support earlier in the year. RSI had been declining alongside price and was approaching oversold.
The Piercing Pattern prints. A long red bearish session continues the decline. The next session opens with a gap below the prior low — at the open, everything looks like the slide is accelerating. But buyers absorb the selling and rally price all day. By the close, the green candle has reclaimed more than half of the prior body, with the close landing comfortably above the midpoint of the prior open and close — but short of the prior open.
The next session. Confirmation arrives the following day: price closes above the high of the piercing candle. The partial recovery extends into real follow-through. Sellers had every advantage going into the gap and still couldn't hold the low — and the next session said the same thing.
Why this one was tradeable. Four conditions stacked: a multi-week downtrend (real selling pressure to undo), the ~$73 support zone (a level buyers had defended before), the midpoint cleared with room to spare (not just barely qualifying), and confirmation the next session. The advance that followed ran roughly ten candles, eventually retracing back toward the prior $78 area.
Common Piercing Pattern Trading Mistakes
The Piercing Pattern's subtlety is both its strength and its trap. Because it's a partial signal, it invites interpretation — and interpretation invites mistakes.
The recovery looks strong enough — close to the middle, probably counts.
Pull out a calculator: add the first candle's open and close, divide by two. If the second close lands at or below that number, the math says the buyers did not reclaim enough ground — whatever the chart looks like. Partial-signal patterns leave no room for "basically."
The shapes line up perfectly in a chop zone — good enough, take it.
The Piercing Pattern earns its meaning by undoing part of an established decline. Inside a range, there is no established decline; the pattern becomes two ordinary candles with no story attached. The decline is what makes the recovery interesting.
The gap doesn't matter — it's the close that counts.
The gap is what makes the recovery impressive. Without it, the second candle is just a bullish session. The gap means sellers extended their control overnight and still lost ground — that's the story.
If I put my stop just a few cents below my entry, the risk-reward math looks great — I'll do that.
The pattern only fails if price breaks below the second candle's gap-down low — that's the level that matches the trade. A stop closer than that will get hit by normal price noise long before the pattern has actually failed. If the real stop distance makes the trade unattractive, the answer is to skip the trade, not move the stop.
The Piercing Pattern formed — load up, the bottom is in.
A partial reversal signal deserves partial conviction. Wait for confirmation. Size appropriately. The Piercing Pattern is a hint, not a guarantee — treat it that way.
- The Piercing Pattern is a two-candle partial reversal — the second candle gaps down but closes above the midpoint of the first candle
- The midpoint rule is a hard requirement: (first candle open + close) / 2 defines the minimum threshold the second candle must clear
- The gap down is essential — without it, the recovery lacks the context that makes the pattern meaningful
- It's weaker than a Bullish Engulfing and stronger than an On-Neck — position it on the spectrum correctly
- Confirmation from the next session matters more here than with stronger patterns — don't skip it
- The strongest setups combine the midpoint close with structural support, elevated volume, and oversold momentum
- Define your stop below the second candle's gap-down low before entering — that's where the recovery launched
Frequently Asked Questions
What is the midpoint rule?
The midpoint rule defines the minimum threshold for a valid Piercing Pattern. Calculate the midpoint of the first candle's body: (open + close) / 2. The second candle must close above this level. If it doesn't, the recovery wasn't strong enough and the pattern doesn't qualify as a Piercing Pattern.
What is the difference between a Piercing Pattern and a Bullish Engulfing?
Both are two-candle bullish reversals where the second candle gaps down and rallies. The difference is how far the recovery goes. A Bullish Engulfing closes above the first candle's open (complete reversal). A Piercing Pattern closes above the midpoint but below the open (partial reversal). The Engulfing is stronger.
Does the Piercing Pattern work in uptrends?
No. The Piercing Pattern is a bullish reversal pattern that only applies after a downtrend. The bearish equivalent — a gap up followed by a close below the midpoint of the prior bullish candle — is called the Dark Cloud Cover. Same structural logic, opposite trend context and direction.
How reliable is the Piercing Pattern?
Reliability depends on context. A Piercing Pattern after a sustained downtrend, at a key support level, with above-average volume and followed by confirmation is significantly more reliable than one in a shallow pullback with no structural support. Context is what determines its weight.
Where should I place my stop loss?
Below the second candle's low — the bottom of the gap-down. That's where buyers launched the recovery. If price breaks below it, the rejection failed and sellers are back in control. Define this level before you enter the trade so your invalidation point is framed in advance.
Why does the gap down matter?
The gap down is what makes the recovery meaningful. It means sellers pushed price lower overnight, beyond the prior session's low. When buyers then rally price back above the midpoint despite that extended selling, it shows genuine demand — not just short covering on a normal open.
The Bottom Line
The Piercing Pattern teaches you something most clean reversal patterns don't: reversals aren't always complete. Sometimes "enough" is enough.
When sellers gap price down, push it below the prior low, and still can't hold buyers back from reclaiming more than half the prior session's losses — that's information. It's not as loud as an Engulfing. It's not as clean. But it's real.
Learning to read partial signals — where the reversal is implied rather than stated — is what separates beginners from experienced chart readers. The Piercing Pattern is your introduction to that skill. Master the midpoint rule, demand confirmation, and respect the gap. The rest is context.
Our 42Fibonacci Scanner checks for these conditions automatically across 3,000+ stocks.
Find Piercing Pattern setups in the scanner →In this guide
42Fibonacci