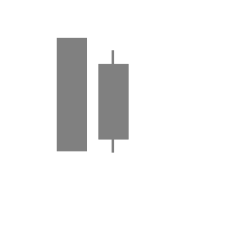
A long red candle rips through a downtrend. Big range, decisive close. Then the next session opens inside that body and closes inside it too — a small candle sitting entirely within the prior one. The market went loud, then quiet.
That's a Bullish Harami. Flip the colors and the context: a large green candle followed by a small inside body after an uptrend is a Bearish Harami.
It's not a reversal. It's an early warning — a whisper that momentum is cooling. The hard part isn't spotting it. It's not overtrading it.
A Harami whispers what an Engulfing shouts. Both are worth hearing — but the whisper requires you to listen more carefully.
What Makes a Harami
The Harami is a two-candle pattern where the second candle's body fits inside the first candle's body. The first candle is large — continuing the prior trend. The second candle is small — open and close both contained within the prior body.
After a downtrend, that's a Bullish Harami — a large red mother candle followed by a small inside candle, hinting that seller momentum is cooling. After an uptrend, the mirror — a large green mother candle wrapping a small inside candle — is a Bearish Harami.
The name comes from the Japanese word for "pregnant" — the large candle is the mother, the small candle sits inside it like a child. The metaphor is apt: something new is forming, but it hasn't been born yet. The pattern suggests potential, not certainty.

How a Bullish Harami Forms
Every candlestick pattern tells a story about a shift in power. The Harami's story is quieter than most — it's about momentum fading, not momentum reversing. Here's what's happening session by session:
"Big red candle. Sellers are in total control. No reason to step in."
The first session is a strong bearish candle — a wide range, a close near the low, conviction selling. This is the trend doing what the trend does. Bears are confident, and the price action confirms it.
"Wait — that's it? After yesterday's move, this is all they could do?"
The second session opens inside the prior candle's body and trades in a much narrower range. Neither buyers nor sellers can push price outside the prior candle's body. The market that was screaming yesterday is suddenly murmuring.
"Momentum is fading. This doesn't mean it's reversing — but something shifted."
By the close, the inside candle is small, contained, and unremarkable. But that's exactly the point. After a big move, the market couldn't follow through. The Harami is a warning that the prior momentum may be slowing — not proof that it has reversed.
Here's the critical distinction most traders miss: the Harami is a warning that momentum is slowing, not proof that it has reversed. A trend can slow down and then reaccelerate. The Harami marks the pause — what comes after the pause is what determines the trade.
Think of it like a car approaching a stop sign. The Harami is the brake lights coming on. The car might stop. It might also just slow down and keep going. You need to watch what happens next before you step into the intersection.
Mirroring for the Bearish Harami: Flip the colors and the trend. Session one is a large green candle continuing an uptrend — buyers in total control, momentum carrying.
Session two opens inside the prior body and trades in a much narrower range. Neither side can push price outside yesterday's candle. The rally that was screaming is suddenly murmuring.
Same lesson, opposite direction: buyer momentum is fading, but the trend hasn't reversed yet. The Bearish Harami is the brake lights at the top — what comes after the pause is what tells you whether the rally stalled or just caught its breath.
The Harami Cross
There's a variant of the Harami that carries more weight: the Harami Cross. This is when the inside candle is a Doji — a candle where the open and close are virtually the same price.
Why is this stronger? Because a regular Harami shows reduced momentum. A Harami Cross shows momentum that has come to a complete standstill. The market went from a strong directional move to absolute indecision in a single session. That's a more dramatic shift than a small-bodied inside candle.
In the case study below, you'll see a Harami Cross in action — a gap-up Doji that formed entirely inside the prior red candle's body. The combination of the gap (showing overnight sentiment shift) and the Doji (showing intraday equilibrium) made for a particularly clean setup.
Bullish vs Bearish Harami
Same structure, opposite context. The deciding factor is the prior trend, not the colors of the candles.
Bullish Harami
After a downtrend, sellers were in control. A large red candle continues the decline; the next session opens inside that body and closes inside it too — a small candle sitting entirely within the prior one.
The market that was screaming yesterday is suddenly murmuring. Seller momentum is cooling — not reversed yet, but the conviction has drained.
Bearish Harami
After an uptrend, buyers were in control. A large green candle continues the rally; the next session opens inside that body and closes inside it too.
The follow-through never came — neither side could push the body outside the prior range. Same structure, same containment rule, same need for a third-candle close to confirm the direction.
Harami vs. Lookalikes
The Harami belongs to a family of patterns that involve relationships between consecutive candles. Confusing them is common — and costly. The key differences are about which candle is bigger and how the bodies relate.
- Small candle inside large prior candle
- Warning signal — momentum cooling, not a confirmed reversal
- The inverse: second candle wraps the first
- Expansion, not contraction — stronger reversal signal
- Entire range (including shadows) inside prior bar
- Harami only requires body containment
The Harami and the Engulfing are inverses of each other — mirror images of the same two-candle relationship. In an Engulfing, the second candle overwhelms the first. In a Harami, the second candle retreats inside the first. One is expansion; the other is contraction. Both are meaningful, but they tell opposite stories about momentum.
The Inside Bar confusion is worth addressing. In Western technical analysis, an Inside Bar requires the entire range — including shadows — to fit within the prior bar. The Harami only requires body containment. A candle can be a valid Harami but not a valid Inside Bar if its shadows extend beyond the mother candle.
How to Trade the Harami
The Harami demands more patience than most patterns. Because it's a warning rather than a confirmed signal, the trading approach needs to account for the possibility that the pause is temporary and the trend resumes.
Confirm the prior trend is real
The Harami only matters after a sustained move in one direction. You need multiple sessions of lower highs and lower lows for a Bullish Harami, or higher highs and higher lows for a Bearish Harami. The larger the mother candle relative to the recent range, the more significant the Harami becomes.
Check the relative size of the candles
The inside candle must be clearly smaller than the mother candle. If the two candles are similar in size, it's not a Harami — it's just two candles next to each other. The contrast in size is what makes the pattern meaningful. The inside candle should look obviously "contained."
Wait for a third-candle confirmation
This is critical with the Harami. Because it's a weaker signal than an Engulfing, you need the third candle to confirm direction.
Watch the third candle. For a Bullish Harami, you want it to close above the mother candle's open. For a Bearish Harami, you want it to close below the mother candle's open.
That close tells you the other side is actually following through on the pause — not just resting before the trend resumes.
Use the mother candle's extreme as your stop
The mother candle's extreme is your invalidation line — its low for a Bullish Harami, its high for a Bearish Harami. If price breaks past that level, the slowdown was just a pause, not a reversal. The mother candle defines the risk — accept it or skip the trade.
A stock has been declining for several weeks and now sits at a known support zone. A textbook Bullish Harami forms — a large red mother candle followed by a small green candle whose body fits entirely inside the mother's body. The third session opens slightly higher but closes back inside the mother candle's body. No decisive break above the mother's open.
Should you enter on the third-candle close?
Reading the Harami in Context
Three lenses decide whether a Harami is a meaningful warning or just a quiet day: volume, structure, and momentum. Each gets its own dedicated guide; this is the quick orientation.
Volume — did the pause arrive or get drifted into? The cleanest read is high volume on the mother candle followed by noticeably lower volume on the inside candle: aggressive selling simply dried up. If the inside candle also trades on high volume, the pause is contested, not clean — buyers and sellers fighting inside a tight range, which is compression rather than relaxation. Read the Candlesticks + Volume guide →
Structure — where on the chart did the Harami form? A Harami at the edge of a range — at support, a prior consolidation zone, or a moving average — is the market pausing exactly where buyers have shown up before. A Harami in open space, with no nearby level to anchor it, is far more likely to be a rest stop than a reversal point. Read the Candlesticks + Moving Averages guide →
Momentum — was the dominant side already running out of fuel? A Harami when RSI is near oversold (or overbought, for the bearish variant) and the MACD histogram is already shrinking is two independent data points pointing at the same thing: the trend is losing steam. A Harami when momentum is still accelerating is a rest, not a reversal. Read the Candlesticks + RSI guide →
Pattern tells me where to look, context tells me whether to act.
Seeing the Harami in Action: $AEP
Here's a Harami Cross that passes every filter — and shows up in a name that doesn't usually make headlines.
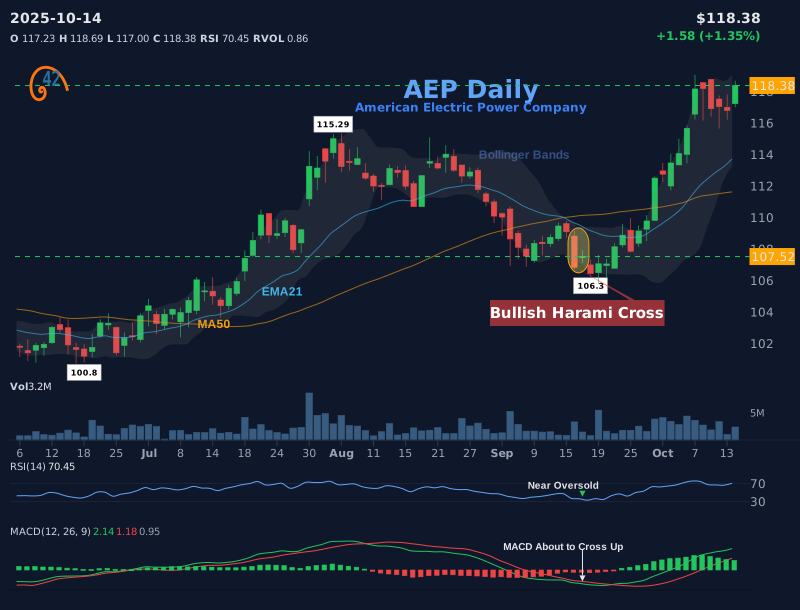
Before the Harami. American Electric Power ($AEP) had been sliding for multiple weeks, grinding lower from an early-October peak near ~$115. No panic selling, no dramatic gap-downs — just steady, persistent pressure. By mid-September, price had worked down to a ~$107 area where buyers had shown up before, with RSI near oversold and the MACD histogram starting to flatten.
The Harami Cross prints. A long red mother candle continues the decline. The next session gaps up and prints a Doji entirely inside the prior body. The gap shows overnight sentiment shifted; the Doji close shows buyers couldn't push further. Decisive selling gave way to a complete standstill in a single session — a stronger signal than a regular small-bodied inside candle.
The follow-through. The sessions immediately after the Harami were all small-bodied — none of them closing past the mother's open. The confirmation finally came on the fourth session after the Harami, when a candle decisively closed above the top of the mother's body. The pattern was real; the directional break just took patience.
Why this one was tradeable. Multi-week decline (real momentum to exhaust), ~$107 support zone (structure), Harami Cross variant (stronger indecision signal than a regular Harami), RSI near oversold and MACD flattening (momentum confirmation). Stack those, and the pattern stops being a shape and starts being a setup. The advance that followed ran roughly ten candles back toward the prior ~$115 peak.
Common Harami Trading Mistakes
The Harami's subtlety is both its strength and its trap. Because the signal is quiet, traders tend to either ignore it entirely or overcompensate by treating it as something it's not.
See a Harami, assume the trend has reversed. Enter immediately and set a big target.
The Harami is a warning that momentum is slowing — not proof it has reversed. Wait for a confirmation candle before acting. Many Haramis lead to nothing more than a brief pause before continuation.
The second candle is a touch smaller than the first — that qualifies.
The whole point of a Harami is the visual collapse from one session to the next: a full-bodied move giving way to something that barely moves at all. If the two bodies look comparable, the market hasn't paused — it's just had a slightly quieter day inside the same rhythm.
The Harami appeared yesterday, so today should be a strong move up.
Momentum is slowing, not reversing yet. The Harami often needs multiple sessions to resolve. Expect a process, not an event. The best Harami setups build slowly.
Trade every Harami, even when the trend is getting stronger with expanding volume.
A Harami in an accelerating trend with rising volume is likely just a rest before the next leg. Focus on Haramis that form after extended moves where momentum is already fading — not where it's still building.
Take the trade, watch it develop, and react to price if it goes the wrong way.
If the mother candle's low gives way, the "pause" narrative was wrong and the downtrend is still in charge — no interpretation required. Nailing that exit trigger down before you commit capital is what distinguishes a framed trade from a hope.
- The Harami is a momentum warning, not a reversal confirmation — the trend is slowing, not necessarily reversing
- The inside candle must be clearly smaller and contained within the mother candle's body
- The Harami Cross (Doji inside candle) is a stronger variant — momentum has come to a complete standstill
- Context makes or breaks this pattern — at support with fading momentum, it's meaningful; in open space, it's noise
- Volume contraction on the inside candle confirms a genuine pause; high volume suggests contested, not clean
- Always wait for a third-candle confirmation — the Harami is too subtle to trade on its own
- Use the mother candle's low as your stop — if it breaks, the setup is invalid
Frequently Asked Questions
What is a Bullish Harami candlestick pattern?
A Bullish Harami is a two-candle reversal pattern in a downtrend. The first candle is a large bearish candle, and the second is a small candle whose body is entirely contained within the first candle's body. The name comes from the Japanese word for "pregnant." It signals that downside momentum may be slowing.
What is a Bearish Harami candlestick pattern?
A Bearish Harami is the mirror of the Bullish Harami, appearing in an uptrend. The first candle is a large bullish candle, and the second is a small candle whose body is fully contained inside it. It signals that upside momentum is stalling and may be reversing — a warning, not a confirmed top.
What is a Harami Cross?
A Harami Cross is a variant where the inside candle is a Doji — open and close virtually the same price. This is considered stronger because it shows momentum has come to a complete standstill, not just a contraction. The shift from decisive selling to equilibrium is more dramatic.
How is the Harami different from an Engulfing pattern?
They are inverses. In a Harami, the second candle is smaller and fits inside the first (momentum contraction). In an Engulfing, the second candle is larger and wraps around the first (momentum expansion). The Engulfing is generally a stronger reversal signal; the Harami is subtler and requires more confirmation.
How do you confirm a Bullish Harami?
Wait for a third candle to close above the mother candle's open (the top of the mother's body). Because the Harami is a weaker signal than patterns like the Engulfing, confirmation is especially important. A confirmation candle with above-average volume adds further conviction and reduces false signals.
Where should I place my stop loss on a Harami trade?
Below the mother candle's low (including the shadow). This is the natural invalidation point — if price breaks below it, the momentum pause was temporary and sellers are still in control. Define this level before entering the trade so your risk is clearly framed in advance.
Does the color of the inside candle matter?
The inside candle can be either bullish (green) or bearish (red). A green inside candle is slightly more bullish because buyers managed to close above the open, but the key signal is the size contraction and containment — not the color. The inside candle's body should be clearly smaller and contained within the mother.
What is the difference between a Harami and an Inside Bar?
The Harami requires the inside candle's real body to fit within the mother candle's body. An Inside Bar requires the entire range — including shadows — to fit within the prior bar. A candle can be a valid Harami but not a valid Inside Bar if its shadows extend beyond the mother.
The Bottom Line
The Harami teaches the skill of reading what's not happening. When a market that was moving aggressively suddenly gets quiet, that silence is information.
It doesn't predict direction. It doesn't confirm a reversal. What it does is flag the exact moment when the prior trend's momentum contracted — and that's the first step in any reversal process. Not the last step. The first.
When you see a Harami after an extended decline, at a meaningful support level, with volume contracting and momentum fading — you're seeing multiple independent signals converging on the same message: this trend is losing conviction. Whether that leads to a reversal or just a rest depends on what comes next. The Harami gives you the heads-up. Confirmation gives you the trade.
Our 42Fibonacci Scanner checks for these conditions automatically across 3,000+ stocks.
Find Harami setups in the scanner →In this guide
'%3e%3crect%20width='240'%20height='240'%20fill='%23FF7A00'%3e%3c/rect%3e%3cg%20transform='matrix(0.07095%200%200%20-0.07095%2015%20220.748)'%20fill='%23FFFFFF'%20stroke='none'%3e%3cpath%20d='M1365%202583%20c-628%20-81%20-1087%20-602%20-1111%20-1258%20-9%20-231%2023%20-399%20111%20-580%20207%20-427%20651%20-631%20900%20-414%20313%20274%2067%20875%20-305%20744%20-177%20-63%20-242%20-307%20-110%20-418%2098%20-83%20230%20-43%20230%2069%200%2047%20-5%2051%20-34%2029%20-55%20-42%20-117%204%20-100%2073%2020%2082%20131%20108%20196%2046%2074%20-71%20100%20-207%2058%20-316%20-65%20-174%20-281%20-266%20-437%20-185%20-146%2075%20-276%20272%20-340%20515%20-34%20128%20-39%20396%20-10%20532%20103%20479%20422%20837%20856%20958%20143%2040%20402%2039%20536%20-1%20434%20-132%20743%20-484%20841%20-959%2019%20-91%2024%20-295%2011%20-413%20-11%20-91%20-2%20-80%2029%2041%2080%20312%2017%20689%20-163%20972%20-253%20397%20-715%20623%20-1158%20565z'%3e%3c/path%3e%3cpath%20d='M2035%201809%20c-63%20-18%20-121%20-85%20-140%20-161%20-6%20-23%20-3%20-27%2027%20-33%2018%20-3%2040%20-9%2050%20-11%2011%20-3%2018%203%2023%2023%2025%20113%20189%20126%20225%2018%2031%20-93%20-7%20-155%20-243%20-409%20-86%20-92%20-88%20-96%20-85%20-138%20l3%20-43%20223%20-2%20222%20-3%200%2045%20c0%2025%20-1%2048%20-2%2053%20-3%207%20-22%208%20-191%2011%20l-98%201%2075%2083%20c167%20181%20210%20263%20204%20379%20-8%20148%20-140%20232%20-293%20187z'%3e%3c/path%3e%3cpath%20d='M1579%201733%20c-29%20-43%20-106%20-154%20-171%20-247%20-107%20-152%20-118%20-173%20-118%20-212%20l0%20-44%20173%20-2%20172%20-3%203%20-88%203%20-89%2052%204%20c32%202%2052%208%2053%2016%201%206%202%2046%203%2087%20l1%2075%2045%200%2045%200%200%2050%200%2050%20-45%200%20-45%200%20-1%20173%20c-1%2094%200%20202%201%20240%20l2%2067%20-60%200%20-60%200%20-53%20-77z%20m58%20-400%20c-3%20-2%20-52%20-2%20-110%20-1%20l-105%203%20107%20155%20106%20155%203%20-154%20c1%20-85%201%20-156%20-1%20-158z'%3e%3c/path%3e%3c/g%3e%3c/g%3e%3c/svg%3e)
42Fibonacci