'%3e%3crect%20width='240'%20height='240'%20fill='%23FF7A00'%3e%3c/rect%3e%3cg%20transform='matrix(0.07095%200%200%20-0.07095%2015%20220.748)'%20fill='%23FFFFFF'%20stroke='none'%3e%3cpath%20d='M1365%202583%20c-628%20-81%20-1087%20-602%20-1111%20-1258%20-9%20-231%2023%20-399%20111%20-580%20207%20-427%20651%20-631%20900%20-414%20313%20274%2067%20875%20-305%20744%20-177%20-63%20-242%20-307%20-110%20-418%2098%20-83%20230%20-43%20230%2069%200%2047%20-5%2051%20-34%2029%20-55%20-42%20-117%204%20-100%2073%2020%2082%20131%20108%20196%2046%2074%20-71%20100%20-207%2058%20-316%20-65%20-174%20-281%20-266%20-437%20-185%20-146%2075%20-276%20272%20-340%20515%20-34%20128%20-39%20396%20-10%20532%20103%20479%20422%20837%20856%20958%20143%2040%20402%2039%20536%20-1%20434%20-132%20743%20-484%20841%20-959%2019%20-91%2024%20-295%2011%20-413%20-11%20-91%20-2%20-80%2029%2041%2080%20312%2017%20689%20-163%20972%20-253%20397%20-715%20623%20-1158%20565z'%3e%3c/path%3e%3cpath%20d='M2035%201809%20c-63%20-18%20-121%20-85%20-140%20-161%20-6%20-23%20-3%20-27%2027%20-33%2018%20-3%2040%20-9%2050%20-11%2011%20-3%2018%203%2023%2023%2025%20113%20189%20126%20225%2018%2031%20-93%20-7%20-155%20-243%20-409%20-86%20-92%20-88%20-96%20-85%20-138%20l3%20-43%20223%20-2%20222%20-3%200%2045%20c0%2025%20-1%2048%20-2%2053%20-3%207%20-22%208%20-191%2011%20l-98%201%2075%2083%20c167%20181%20210%20263%20204%20379%20-8%20148%20-140%20232%20-293%20187z'%3e%3c/path%3e%3cpath%20d='M1579%201733%20c-29%20-43%20-106%20-154%20-171%20-247%20-107%20-152%20-118%20-173%20-118%20-212%20l0%20-44%20173%20-2%20172%20-3%203%20-88%203%20-89%2052%204%20c32%202%2052%208%2053%2016%201%206%202%2046%203%2087%20l1%2075%2045%200%2045%200%200%2050%200%2050%20-45%200%20-45%200%20-1%20173%20c-1%2094%200%20202%201%20240%20l2%2067%20-60%200%20-60%200%20-53%20-77z%20m58%20-400%20c-3%20-2%20-52%20-2%20-110%20-1%20l-105%203%20107%20155%20106%20155%203%20-154%20c1%20-85%201%20-156%20-1%20-158z'%3e%3c/path%3e%3c/g%3e%3c/g%3e%3c/svg%3e)
A candlestick is a shape. Context turns it into a setup.
SCREENERS · STRATEGIES · RESEARCH · GUIDES
80+ candlestick patterns across bullish and bearish reversals and continuations — each checked against trend, momentum, volume, and structure. Scanned daily after the US close, then followed to confirmation or invalidation.
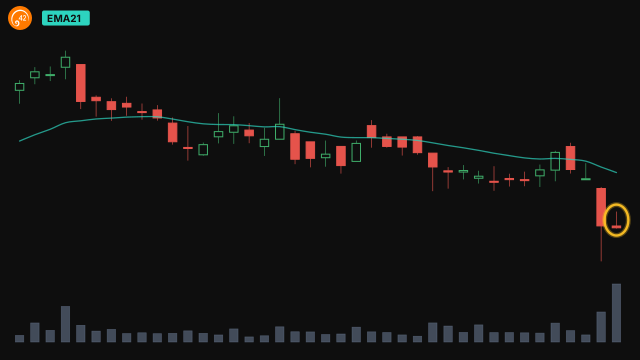 Inverted HammerOversold · RSI 27Above MA200Volume surge · 4.04×1 more readingsBULLISH REVERSALHOODRobinhood Markets, Inc.2026-10-08
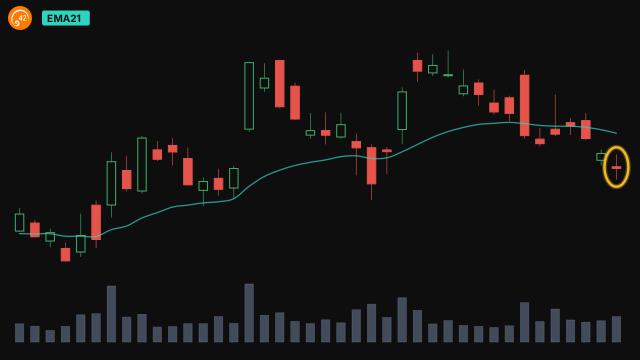 Spinning TopAbove MA50/MA200Near MA50Neutral · RSI 463 more readingsBULLISH REVERSALAVNTAvient Corporation2026-10-09
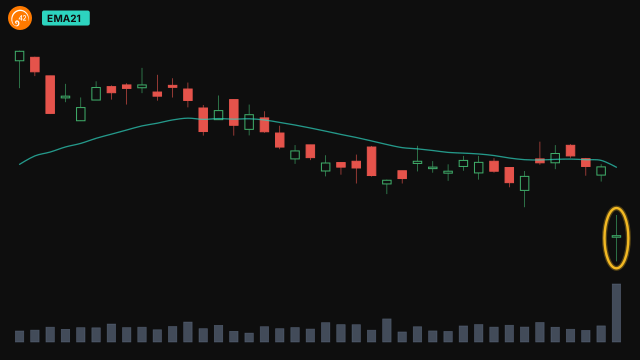 Spinning TopOversold · RSI 25Volume surge · 3.33×Near MA2002 more readingsBULLISH REVERSALELVNEnliven Therapeutics, Inc.2026-10-08
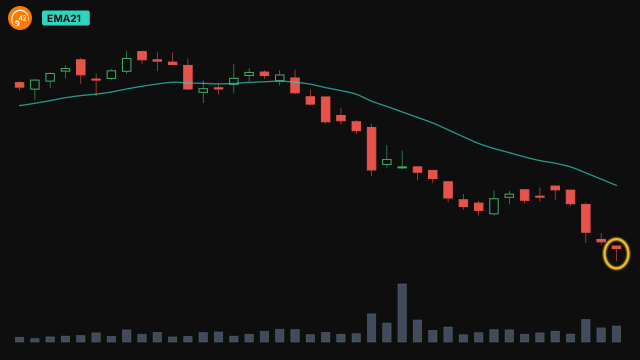 HammerOversold · RSI 21Near MA200MACD crossed up3 more readings
Bullish Reversal
Downtrends showing a credible turn up — engulfings, hammers, piercing and more, with supporting context.
Open the screener →Read the patterns. Learn the context.
Common questions.
Once per session, after the US market close. The timestamp at the top of the page shows the last completed scan.
Agreement between a candlestick pattern and the readings around it — momentum stretched the right way, a trend on the setup’s side, heavy volume, price at a level that has held before. The screeners highlight each supporting reading on a setup’s row, and sort the best-supported first.
US equities across the S&P 500, Nasdaq 100 and Russell 2000, filtered for adequate liquidity.
No. We surface technical setups and the context behind them. Every decision — and its risk — remains yours.
Daily candles today, with intraday and weekly scans on the roadmap.
No. Track-record statistics are historical and educational; markets change and individual results will vary.