
Day one: a long red candle. The downtrend is still winning. Day two: a tiny body — the "star" — drifts lower and closes near the open. Neither side commits. Day three: a strong green candle tears back through the first candle's body. Fear, then hesitation, then conviction.
That's a Morning Star.
It's the first pattern that plays out as a story instead of a moment — three candles, three psychological states, one reversal. Reading narrative across sessions is a different skill than reacting to a single candle. This is where that skill begins.
Two candles show a conflict. Three candles tell a story — and the Morning Star tells the story of fear turning into conviction.
What Makes a Morning Star
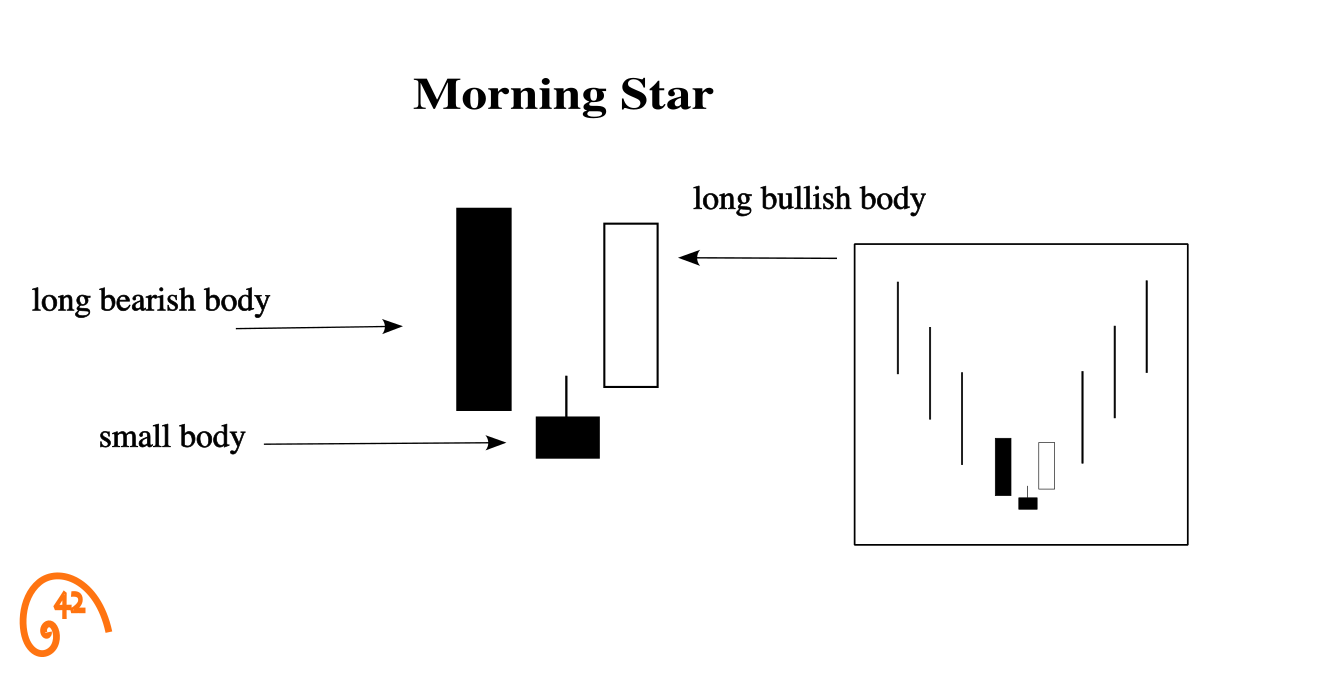
The Morning Star is a three-candle bullish reversal pattern that appears after a decline. Each candle plays a specific role in the sequence:
- Candle 1: A large bearish candle. The decline is still in control — sellers are confident, and the session closes near its low.
- Candle 2 (the "star"): A small-bodied candle — often a Doji or Spinning Top. It signals hesitation. Neither side has conviction. The range is narrow. The market is pausing.
- Candle 3: A large bullish candle that closes well into the body of Candle 1. This is the answer — buyers have shown up with force.
The name comes from the morning star — the bright point of light visible in the sky just before dawn. After the downtrend's "night," the small middle candle is the first sign that a bullish reversal may be coming.
Reading Across Sessions: The Three Acts
The Morning Star plays out across three sessions: bearish conviction, a pause, then a bullish answer. Reading the full arc — instead of reacting candle by candle — is what this pattern teaches.
"Another ugly close. No reason to step in. This thing is still going lower."
A large bearish candle confirms the prevailing downtrend. Sellers are confident. Buyers who tried to catch the bottom earlier are underwater. The session closes near its low — there's no sign of support.
"It's... not going lower? Weird. Not buying yet, but the selling dried up."
The next session opens and trades in a narrow range. A small body — sometimes a Doji, sometimes a Spinning Top. Volume often drops. This is the critical moment: sellers have run out of momentum, but buyers haven't committed yet. The market is holding its breath.
"Look at that candle. Buyers just took over. Something changed."
A strong bullish candle opens near the star's close and rallies hard, closing well into the body of Candle 1. This isn't short covering — this is genuine buying pressure. The transition from fear to hesitation to renewed confidence is complete.
Each candle's meaning depends on what came before. A Doji alone is indecision. A Doji as Candle 2 of a Morning Star is the pause that makes the reversal credible — same shape, completely different signal.
Morning Star vs. Evening Star
The Morning Star has a direct bearish counterpart: the Evening Star. Same three-act structure, opposite direction. If you understand one, you already understand the other.
- Appears after a downtrend
- Three candles: bearish, small body, bullish
- Signals a potential bottom — fear gives way to conviction
- Appears after an uptrend
- Three candles: bullish, small body, bearish
- Signals a potential top — confidence gives way to fear
The mechanics are identical in both: a strong move, a small-bodied pause, then a strong move in the opposite direction. The pause is what defines the pattern in either direction — without that middle candle, you're looking at a two-candle reversal, not a Star.
How to Trade the Morning Star
Trading a three-candle pattern requires more patience than a single-candle setup. You're watching a story unfold across sessions — and the entry only comes after the story is complete.
Confirm a real downtrend is in place
The Morning Star is a reversal pattern — it needs something to reverse. Look for multiple sessions of lower highs and lower lows. A two-day dip doesn't count. The decline should be clear and sustained enough that market sentiment has shifted bearish.
Wait for all three candles to complete
This is where beginners go wrong. Candle 2 — the star — is not the signal. It's the pause. The signal is Candle 3: a strong bullish close that pushes well into Candle 1's body. Until that third candle closes, you don't have a Morning Star. You have two candles and a guess.
Evaluate the quality of the third candle
Not all third candles are equal. A strong Candle 3 closes in the upper half of Candle 1's body — ideally above the midpoint. A weak Candle 3 that barely enters Candle 1's range isn't convincing. The deeper the penetration into Candle 1, the stronger the signal.
Check what's underneath the pattern
The best Morning Stars form at structural levels — prior support, moving averages, Fibonacci zones. When all three candles sit on a support level, the pattern isn't just a reversal signal — it's a mini-base forming at a level where buyers have shown up before.
Define your risk before you enter
The pattern spans three candles, so the stop is wider than a single-candle setup. Place your stop below the low of the entire formation (usually the low of Candle 2 or Candle 1, whichever is lower). Accept the wider stop as the cost of a higher-conviction setup — and size accordingly.
You spot two candles of a potential Morning Star: a large bearish candle yesterday, and today a small Doji formed. The stock is at support with RSI near oversold. You're tempted to buy now before the third candle forms — you don't want to miss the move.
Should you enter now, after the second candle?
Reading the Morning Star in Context
Three lenses decide whether a Morning Star is a real reversal or a three-candle coincidence: volume, structure, and momentum. Each gets its own dedicated guide; this is the quick orientation.
Volume — did participation track the story? In the ideal Morning Star, volume tells its own three-act arc: moderate on Candle 1 as the decline continues, low on Candle 2 as the selling dries up, and high on Candle 3 as real buying steps in. Low volume on the star means sellers ran out of steam; high volume on the third candle means the reversal has participation behind it, not just short covering. See the Candlesticks + Volume guide →
Structure — where on the chart did the three candles form? When all three sit at a prior support zone, the 50-day or 200-day moving average, or a Fibonacci retracement, you don't just have a pattern — you have a mini-base. Three sessions of price holding at the same level is more meaningful than one. The pattern says sentiment is shifting; the structure says where. See the Candlesticks + Moving Averages guide →
Momentum — was the dominant side stretched going in? Check RSI heading into the pattern. A reading near or below 30 means sellers were already exhausted — the Morning Star's bullish answer has a real chance of marking a turn rather than a pause. If RSI is mid-range when the pattern forms, the decline likely still has room to run. MACD adds confirmation when it crosses bullish during or shortly after the formation, but expect that crossover to lag the pattern by a session or two — MACD's smoothing usually doesn't move that fast. Candlesticks + RSI guide →
Pattern tells me where to look, context tells me whether to act.
Seeing the Morning Star in Action: $HIMS
Here's a Morning Star that played out cleanly — three candles at support, with momentum confirming on the same timeline.

Before the Morning Star. Hims & Hers Health ($HIMS) rallied into a late-July 2025 peak, then sold off steadily through August toward a prior support zone. Buyers who chased the highs were underwater. The chart looked like another breakdown in progress.
The Morning Star prints. In late August, directly at the support zone, the first candle continued the decline with a strong bearish close. The second session traded in a narrow range — a small body, lower volume, sellers out of ammunition but buyers not yet committed. The third candle answered with a strong bullish close that pushed well into the first candle's body.
Why this one was tradeable. Sustained prior downtrend from the late-July peak, pattern formed at a real support zone, MACD bullish crossover during the three-candle window, and a strong third candle that closed deep into Candle 1's body. A bullish trend followed through late September.
Common Morning Star Trading Mistakes
The Morning Star is straightforward to identify in hindsight — but easy to mistime in real time. Most failed trades come from impatience or from applying rules that don't fit modern markets.
The star appeared! That's the signal — buy now before the move starts.
The star is the pause, not the signal. Candle 3 — the strong bullish close — is what confirms the pattern. Until it closes, you have indecision, not a reversal.
Any bullish bar completes the pattern — the color is what matters.
A timid green body that barely dents the first candle's range isn't the conviction move the Morning Star is supposed to deliver. The third session has to push meaningfully into — ideally past the midpoint of — the original selling candle. Soft answers don't reverse hard moves.
A Morning Star appeared — this is THE bottom. Load up.
The Morning Star signals a potential reversal at the current level, not the absolute bottom. Trade it as a setup with defined risk, not a prediction. It can fail like any other pattern.
Three-candle sequence checks out — that's the whole job.
The same three candles forming on top of MA 200 support are a very different trade than the same three candles drifting through mid-range price action. Where the pattern sits is the silent co-author of whether it works; ignoring it is ignoring half the setup.
I'll buy the same number of shares I would for any other pattern — the candle count doesn't matter.
The Morning Star's stop sits below the entire three-candle formation, which is farther from your entry than a single-candle stop. Buying the same number of shares means your dollar risk is now two or three times higher than usual. Reduce the share count so the dollar risk on the trade matches what you'd risk on a single-candle setup.
- The Morning Star is a three-candle reversal pattern: bearish continuation, hesitation, bullish answer
- Each candle plays a role — don't act until all three have closed and the story is complete
- The middle candle (the star) is the pause, not the signal — Candle 3 provides the confirmation
- Candle 3 must be strong: it should close well into Candle 1's body to show genuine conviction
- Gaps between candles are NOT required in modern markets — focus on the sequence, not the spacing
- The pattern spans 3 candles, so the stop is wider — adjust position size to keep risk consistent
- A Morning Star at a structural level with a MACD cross is stronger than the pattern alone
Frequently Asked Questions
What is a Morning Star candlestick pattern?
The Morning Star is a three-candle bullish reversal pattern that forms after a downtrend. It consists of a large bearish candle, a small-bodied candle (the star), and a large bullish candle that closes well into the first candle's body. The sequence represents a transition from selling pressure to hesitation to buying.
Does the Morning Star require gaps between the candles?
No. Traditional Japanese analysis describes gaps between the star and the surrounding candles, but in modern stock markets — especially with pre-market and after-hours trading — gaps are rare. The pattern is defined by the three-candle sequence, not the spacing. Don't disqualify a valid Morning Star because the candles overlap.
What is the middle candle in a Morning Star?
The middle candle — called the "star" — is a small-bodied candle that signals indecision. It can be a Doji, a Spinning Top, or any candle with a small real body. Its color doesn't matter much. What matters is that selling pressure has stalled without buyers yet taking control.
What is the difference between a Morning Star and an Evening Star?
They are mirror images. A Morning Star forms after a downtrend and signals a bullish reversal (bearish candle, small body, bullish candle). An Evening Star forms after an uptrend and signals a bearish reversal (bullish candle, small body, bearish candle). Same three-act structure, opposite directions.
How do you confirm a Morning Star pattern?
The pattern is confirmed when Candle 3 — the bullish candle — closes. It should close well into Candle 1's body, ideally above the midpoint. A weak or small third candle doesn't provide real confirmation. Additional weight comes from volume (higher on Candle 3) and momentum indicators turning bullish.
Where should I place my stop on a Morning Star trade?
Below the low of the entire three-candle formation — whichever candle has the lowest low. Because the pattern spans three sessions, the stop is wider than a single-candle setup. Adjust your position size to keep dollar risk consistent with your risk management rules for the trade.
How is the Morning Star different from a Bullish Engulfing?
Both signal bullish reversals after a decline, but the Morning Star includes a hesitation phase (the middle candle) that the Bullish Engulfing lacks. The Engulfing compresses the reversal into two candles — selling followed immediately by larger buying. The Morning Star adds a pause, which some traders view as a more deliberate transition.
The Bottom Line
The Morning Star teaches something that single-candle and two-candle patterns can't: how to follow a narrative across sessions. It's the pattern that proves patience across multiple sessions is a skill, not just waiting.
When you learn to read the three acts — decline, hesitation, answer — you stop reacting to individual candles and start reading the market's story as it unfolds. That's a fundamentally different way of looking at charts, and it applies far beyond this single pattern.
When you see a Morning Star after a clear decline, at a meaningful support level, with volume confirming and momentum turning — you're looking at one of the most structured reversal setups in candlestick analysis. Three sessions. Three acts. One clear story.
Our 42Fibonacci Scanner checks for these conditions automatically across 3,000+ stocks.
Find Morning Star setups in the scanner →In this guide
42Fibonacci