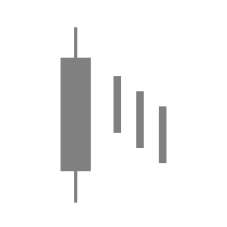
Candlesticks + Volume: Confirming Conviction
See live examples in scanner →A Hammer forms at support. Clean shape, textbook structure. Then you glance at the volume bar underneath. In one case, volume is well below average — almost nobody traded. In the other, it's more than double the average — the whole market participated. Same candle, very different meaning.
That difference is what volume measures — participation.
Price tells you what happened. Volume tells you how many people agreed. It's the line between a pattern that played out in a quiet room and one that played out in front of the entire market — and usually, between signal and noise.
Price tells you what happened. Volume tells you whether anyone cared.
What Is Volume
Volume is the number of shares traded during a session. Every time a buyer and a seller agree on a price, that transaction adds to the day's volume count.
For daily charts — the timeframe most relevant to swing traders and position traders — volume represents the total shares exchanged from market open to close. It's the simplest measure of participation: how many people showed up to trade today.
Volume doesn't tell you direction. It doesn't tell you whether the buyers were right or the sellers were right. It tells you how much activity backed the move — and that distinction matters more than most traders realize.
Absolute vs Relative Volume
Here's where most beginners go wrong: they compare raw volume numbers across different stocks. A stock like AAPL might trade 50 million shares on a quiet day. A mid-cap stock might trade 500,000 shares on its busiest day of the year. Comparing those numbers tells you nothing.
What matters is relative volume (rVol) — today's volume compared to the stock's own recent average. The standard benchmark is the 20-day average volume, which captures roughly one month of trading activity.
When a stock that normally trades 1 million shares suddenly trades 2.5 million, that's an rVol of 2.5x — participation is two and a half times higher than normal. That is meaningful information, regardless of whether the stock is large-cap or small-cap. Above 1.5x is elevated; above 2.0x is strong; below 0.8x is quieter than usual and worth treating with skepticism.
Relative volume normalizes the playing field. It answers the only question that matters: is today's participation unusual for this stock?
Why Volume Changes Everything
Price action alone is incomplete. A candlestick tells you what happened — the open, high, low, close, the shape of the session. But it doesn't tell you how much conviction backed that outcome.
Consider two identical Hammers. Same shape, same lower shadow length, same small body near the top. One forms on 0.6x average volume. The other forms on 2.3x average volume. The chart looks the same. The meaning is completely different.
The low-volume Hammer means a few participants happened to push price down and a few others happened to push it back up. It could be random — thin-tape noise on a quiet afternoon. The high-volume Hammer means a large number of participants actively sold into the decline and a large number of buyers overwhelmed them by the close. That's a genuine battle with a clear winner.
Volume answers the question that price alone cannot: "How much conviction backed this move?" The same logic runs in reverse. When a sustained rally or sell-off keeps printing on shrinking volume, fewer participants are driving each new high or low. Price continues, but the audience is leaving the room — a warning that conviction is fading even before the move turns.
How Volume Confirms Signals
Volume confirmation works on two levels: the signal candle and the follow-through. Understanding both turns volume from a background indicator into an active filter for every setup you evaluate.
Check volume on the signal candle
When a reversal pattern forms, compare its volume to the 20-day average. Above-average volume means the outcome — whether it's a Hammer's rejection, a Doji's standoff, or an Engulfing's takeover — was backed by meaningful participation. Below-average volume means fewer people were involved, reducing the signal's weight.
Check volume on the confirmation candle
The day after the signal matters just as much. A confirmation candle that closes in the expected direction on above-average volume means new participants are joining the move. A confirmation close on low volume means the follow-through is thin — it might not last.
Look for volume expansion, not just high volume
The strongest setups show volume increasing from the signal candle to the confirmation candle. This expansion means conviction is building, not just spiking. A single high-volume session followed by a quiet one is less convincing than two sessions of rising participation.
Use volume as a filter, not a requirement
Not every valid setup will have textbook volume. The goal is to prioritize setups where volume supports the signal and be more cautious when it doesn't. Volume shifts probabilities — it doesn't create certainties.
The Doji Filter
Volume is important for every candlestick pattern, but it's especially critical for Dojis. Here's why.
Most Dojis are noise. They appear frequently — in ranges, mid-trend, on quiet afternoons when nothing is happening. A Doji just means the open and close were nearly equal. That can happen because two massive armies fought to a standstill, or it can happen because almost nobody traded and price drifted sideways.
Volume is the only way to tell the difference. A Doji on 2x average volume after a sustained downtrend at a support level is a session where buyers and sellers genuinely collided. Neither side could win, and the resulting indecision is meaningful because it happened with high participation. When the next candle resolves the standoff with a strong close in one direction, you have a setup worth acting on.
A Doji on 0.5x average volume in the middle of a range? That's a non-event. No one showed up. The indecision isn't meaningful because there was barely any activity to be indecisive about. Filtering Dojis by volume eliminates the majority of false signals that trap traders who rely on shape alone.
Pattern tells me where to look, context tells me whether to act.
Real Example: Volume on the Signal Candle
Volume's most direct impact shows up on the signal candle itself — elevated participation is what gives a pattern its conviction at the moment it forms. Here's a Spinning Top on HCA Healthcare ($HCA) where the indecision arrived with the heaviest participation in months.
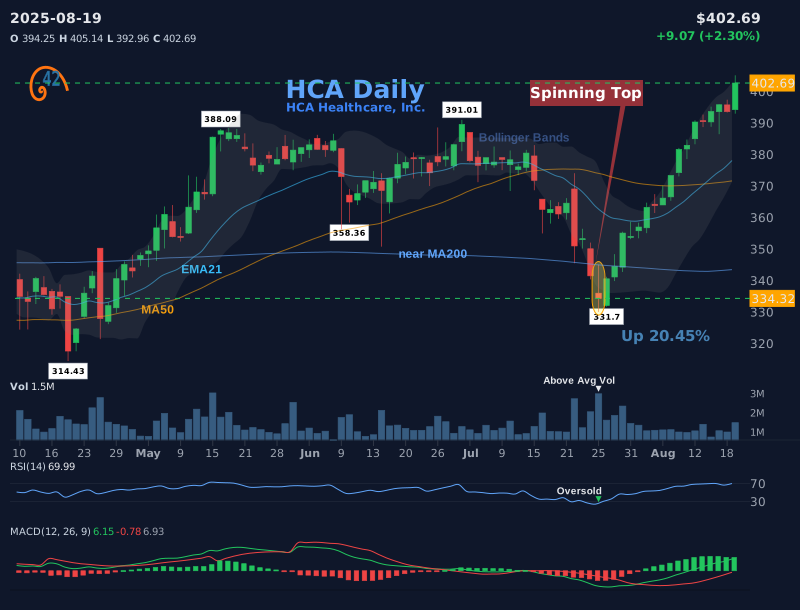
Before the Spinning Top. $HCA had been in a sustained downtrend through the summer of 2025. Rallies kept failing — the structural regime was bearish.
The pattern prints. On July 25, 2025, a Spinning Top formed — a small body with shadows on both sides, the signature of a momentum pause. On its own, a Spinning Top is a candle of indecision. What changed everything was the volume bar underneath: well above the 20-day average, the heaviest participation in months.
What volume context added. A low-volume Spinning Top in the same place would have been easy to dismiss as a quiet drift. Elevated volume meant a large number of participants actively traded into the indecision — buyers and sellers both showing up in size. Neither side could close the session in their favor, but both sides cared. That's a real standoff, not a lull.
Why this one was tradeable. Sustained prior decline, a recognized indecision pattern, and — the deciding factor — heavy participation on the candle itself. Strip the volume out and you have a routine Spinning Top that any chart will produce a dozen times a year. Add the volume back and the indecision becomes a signal worth watching for the next session's resolution.
Common Volume Mistakes
Volume is straightforward in concept but easy to misapply. These are the most common mistakes that undermine how traders use volume with candlestick analysis.
"The shape is all that matters. If the candle looks like a Hammer, it's a Hammer."
Shape tells you what happened. Volume tells you whether the outcome was meaningful. A textbook pattern on thin volume is a pattern without conviction. Always check relative volume before acting on a signal.
"This stock traded 5 million shares — that's high volume."
Five million shares might be a quiet day for one stock and an extraordinary day for another. Use relative volume (rVol) — today's volume compared to the stock's own 20-day average. That's the only comparison that works.
"Volume spiked, so something important is happening — time to trade."
High volume can confirm either direction. A high-volume bearish candle confirms selling pressure just as much as a high-volume Hammer confirms buying rejection. Volume tells you participation is elevated — you still need the price action to determine direction.
"rVol printed 1.4 instead of my 2.0 rule, so the setup is automatically out."
Participation is a dimmer switch, not a light switch. A 1.4 reading is still telling you more people showed up than usual — just less emphatically than 2.0 would. The right response is to weight the trade slightly less, not to throw it away on a rounding decision.
"Volume is surging, so I should buy regardless of what price is doing."
Volume without price action is meaningless. A volume spike tells you participation is elevated — but it doesn't tell you direction, pattern, or context. Volume is a modifier for candlestick signals, not a signal by itself.
- Volume measures participation — how many people backed the move, not which direction it went
- Always use relative volume (rVol vs 20-day average), never absolute share counts
- Signal volume: above-average on the pattern candle means the outcome had conviction behind it
- Follow-through volume: above-average on the confirmation candle means new participants are joining
- Volume decline during a move warns that conviction is fading, even if price continues
- Dojis benefit the most from volume filtering — most low-volume Dojis are noise, not signals
- Volume is a filter that shifts probabilities, not a binary pass/fail test
A Hammer forms after a 2-week decline. The shape is textbook — small body near the top, long lower shadow at least 2x the body. It's sitting right at a prior support level. But volume is only 0.6x the 20-day average — well below normal.
Should you trade this Hammer?
Frequently Asked Questions
What is relative volume (rVol)?
Relative volume is today's volume divided by the 20-day average volume. An rVol of 1.5x means today's participation is 50% higher than normal. It normalizes volume across different stocks so you can compare participation levels regardless of market cap or typical trading activity.
Does volume predict direction?
No. Volume tells you how much participation backed a move, not which direction the move will continue. High volume can confirm bullish signals (like a Hammer) or bearish signals (like a Shooting Star). Direction comes from price action and pattern context — volume tells you whether the outcome was meaningful.
What rVol level counts as "above average"?
There is no universal threshold. Generally, 1.5x or higher is elevated and 2.0x or higher is strong. But volume is a spectrum, not a pass/fail test. A signal on 1.3x volume is more meaningful than one on 0.7x volume, even though neither hits the 1.5x benchmark.
Is volume more important for some patterns than others?
Yes. Patterns that signal indecision — like Dojis and Spinning Tops — benefit the most from volume filtering because they appear frequently and most occurrences are noise. Volume separates meaningful standoffs from quiet non-events. Directional patterns like Engulfing candles are inherently stronger, so volume is confirmatory rather than essential.
What if the signal candle has low volume but the confirmation candle has high volume?
That's still useful information. The signal formed quietly, but the follow-through attracted real participation. This is a weaker setup than having high volume on both candles, but the confirmation volume shows that the market responded to the pattern even if the pattern itself was quiet. Proceed with caution.
Why use a 20-day average instead of a 50-day or 10-day?
Twenty trading days is roughly one calendar month — long enough to smooth out single-day spikes but short enough to reflect recent changes in a stock's trading profile. A 50-day average is too slow to capture shifts in baseline activity. A 10-day average is more responsive but noisier.
The Bottom Line
Volume doesn't predict direction. It tells you whether the move had an audience — and signals without an audience rarely follow through.
Every candlestick pattern you've learned — Hammers, Dojis, Engulfing candles, Harami patterns — becomes more reliable when you add this one question: "Was participation above average?" That single filter will eliminate a significant portion of the noise that traps traders who rely on shape alone.
Relative volume is the metric. The 20-day average is the baseline. Above 1.5x is elevated. Above 2.0x is strong. Below 0.8x should make you skeptical. It's not complicated — it just requires checking one number before you act.
Our 42Fibonacci Scanner calculates relative volume for every setup across 3,000+ stocks.
See volume context in the scanner →In this guide
'%3e%3crect%20width='240'%20height='240'%20fill='%23FF7A00'%3e%3c/rect%3e%3cg%20transform='matrix(0.07095%200%200%20-0.07095%2015%20220.748)'%20fill='%23FFFFFF'%20stroke='none'%3e%3cpath%20d='M1365%202583%20c-628%20-81%20-1087%20-602%20-1111%20-1258%20-9%20-231%2023%20-399%20111%20-580%20207%20-427%20651%20-631%20900%20-414%20313%20274%2067%20875%20-305%20744%20-177%20-63%20-242%20-307%20-110%20-418%2098%20-83%20230%20-43%20230%2069%200%2047%20-5%2051%20-34%2029%20-55%20-42%20-117%204%20-100%2073%2020%2082%20131%20108%20196%2046%2074%20-71%20100%20-207%2058%20-316%20-65%20-174%20-281%20-266%20-437%20-185%20-146%2075%20-276%20272%20-340%20515%20-34%20128%20-39%20396%20-10%20532%20103%20479%20422%20837%20856%20958%20143%2040%20402%2039%20536%20-1%20434%20-132%20743%20-484%20841%20-959%2019%20-91%2024%20-295%2011%20-413%20-11%20-91%20-2%20-80%2029%2041%2080%20312%2017%20689%20-163%20972%20-253%20397%20-715%20623%20-1158%20565z'%3e%3c/path%3e%3cpath%20d='M2035%201809%20c-63%20-18%20-121%20-85%20-140%20-161%20-6%20-23%20-3%20-27%2027%20-33%2018%20-3%2040%20-9%2050%20-11%2011%20-3%2018%203%2023%2023%2025%20113%20189%20126%20225%2018%2031%20-93%20-7%20-155%20-243%20-409%20-86%20-92%20-88%20-96%20-85%20-138%20l3%20-43%20223%20-2%20222%20-3%200%2045%20c0%2025%20-1%2048%20-2%2053%20-3%207%20-22%208%20-191%2011%20l-98%201%2075%2083%20c167%20181%20210%20263%20204%20379%20-8%20148%20-140%20232%20-293%20187z'%3e%3c/path%3e%3cpath%20d='M1579%201733%20c-29%20-43%20-106%20-154%20-171%20-247%20-107%20-152%20-118%20-173%20-118%20-212%20l0%20-44%20173%20-2%20172%20-3%203%20-88%203%20-89%2052%204%20c32%202%2052%208%2053%2016%201%206%202%2046%203%2087%20l1%2075%2045%200%2045%200%200%2050%200%2050%20-45%200%20-45%200%20-1%20173%20c-1%2094%200%20202%201%20240%20l2%2067%20-60%200%20-60%200%20-53%20-77z%20m58%20-400%20c-3%20-2%20-52%20-2%20-110%20-1%20l-105%203%20107%20155%20106%20155%203%20-154%20c1%20-85%201%20-156%20-1%20-158z'%3e%3c/path%3e%3c/g%3e%3c/g%3e%3c/svg%3e)
42Fibonacci