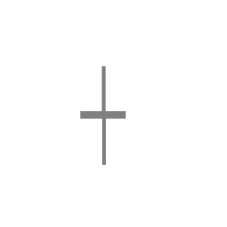
A stock has been sliding for weeks. Every session, sellers push it lower. Then one day the market fights both directions and closes exactly where it opened. No body. Just a thin cross with shadows on both sides.
That's a Doji — the most misread signal in candlestick trading.
Most traders see one and call it a reversal. The real skill is knowing when it is and when it's noise. Context decides direction: at support after a downtrend, bullish. At resistance after an uptrend, bearish.
The market is a conversation. The Doji is a long silence. What matters is what gets said next.
What Makes a Doji
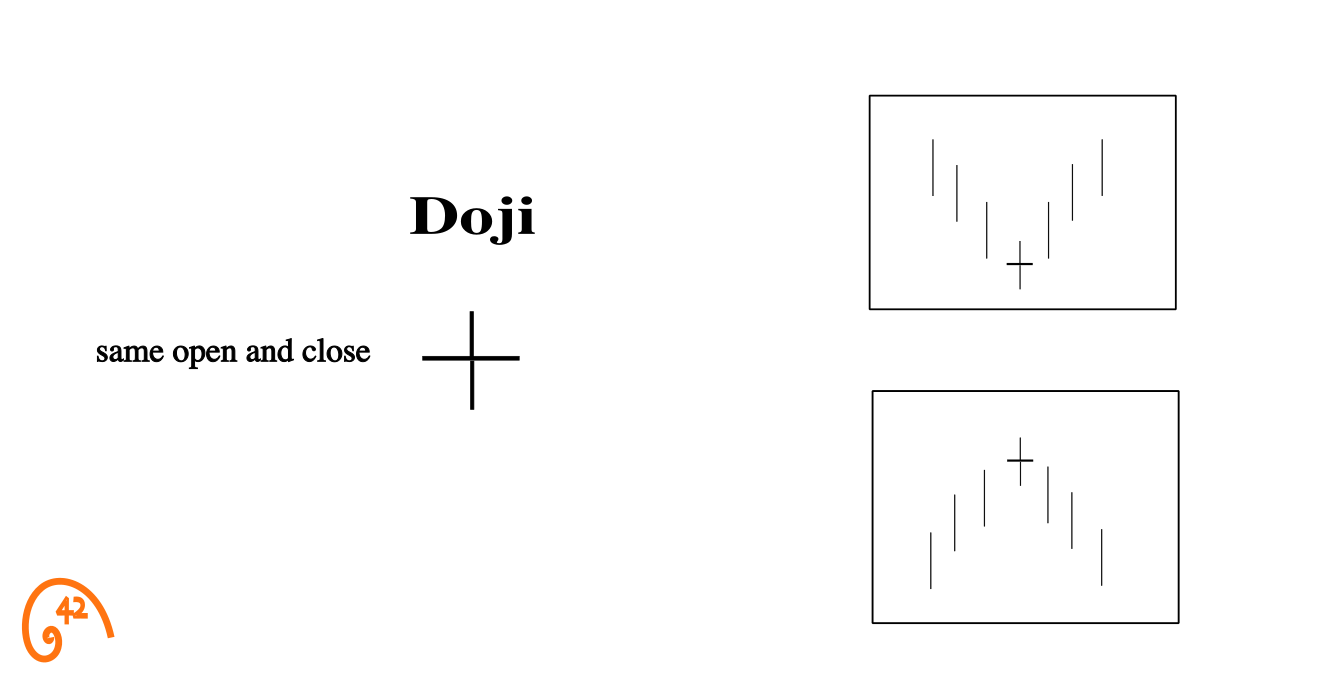
The Doji is defined by one thing: the open and close are nearly identical. This creates a candle with little to no real body — just a thin line (or cross) with shadows extending above and below.
The word "Doji" comes from Japanese, meaning "the same thing" — referring to the open and close landing at the same price. It's the simplest candlestick to identify and the most commonly misunderstood.
How a Doji Forms
If the Hammer tells a story of seller failure and the Inverted Hammer tells a story of buyer challenge, the Doji tells a story of mutual exhaustion. Neither side could hold their gains.
"There's demand here. Price is moving up."
During the session, buyers push price above the open. Depending on how far they push, this creates the upper shadow. For a moment, it looks like buyers might take control.
"Not so fast. Sellers are hitting every bid."
Sellers respond. They push price below the open, creating the lower shadow. Buyers who went long during the rally are now underwater. It looks like sellers might take control.
"After all that, we're right back where we started."
By the close, price returns to the open. All that buying and selling, all that intraday volatility — and the net result is zero. Neither side could hold their gains. That's the Doji.
What the Doji teaches is this: sometimes the most important information is that nobody knows what comes next.
After a strong trend, that uncertainty is new. It means the dominant side is losing conviction—and that's the first crack in the trend, before a reversal has even begun.
But after a choppy, directionless market? A Doji just confirms what was already obvious: nobody has control. That's not a signal. That's the status quo.
The Doji Family
The classic Doji (equal shadows both sides) is just one member of a family. Each variant tells a slightly different story based on where the shadows fall.
- Open = close, shadows both sides
- Pure indecision — balanced battle
- Same stalemate but much wider range
- Extreme volatility, extreme indecision
- Long lower shadow only, close at the high
- Sellers pushed down but buyers reclaimed everything
- Long upper shadow only, close at the low
- Buyers pushed up but sellers reclaimed everything
The classic Doji is the most neutral—shadows on both sides, no directional lean. Neither buyers nor sellers could take control.
The Dragonfly and Gravestone variants add a tilt. A Dragonfly shows sellers pushed price lower and failed to hold it. A Gravestone shows buyers pushed higher and were rejected. Same indecision, but with a clear side that lost.
The Long-Legged Doji is the most dramatic—wide range, heavy movement in both directions, and still no resolution. Maximum activity, same stalemate.
Most patterns teach you when to act. The Doji teaches you when to wait. That's the harder — and more valuable — skill.
Bullish Doji vs Bearish Doji
The Doji itself has no direction. The prior trend gives it direction — a Doji after a downtrend reads as a potential bullish reversal; after an uptrend, a potential bearish reversal. Same candle, opposite stories, decided entirely by what came before it.
The two to distinguish:
Bullish Doji
Appears after a downtrend. Sellers were in control — multiple sessions of lower closes — then a Doji prints. The stalemate doesn't mean buyers won. It means sellers lost their grip. That's the first crack.
Bearish Doji
Appears after an uptrend. Buyers were in control — multiple sessions of higher closes — then a Doji prints. The stalemate doesn't mean sellers won. It means buyers lost their grip. That's the first crack.
The Long-Legged Doji and Spinning Top read the same way: bullish after a downtrend, bearish after an uptrend.
When NOT to Trade a Doji
This is the section most guides skip — and it's arguably the most important part of understanding the Doji. Most Dojis should not be traded.
A Doji in a choppy, range-bound market is just the market doing what it always does: going nowhere. Indecision inside indecision is not a signal. It's noise.
Skip it in sideways markets
If price has been consolidating — no clear higher highs or lower lows — a Doji is just more of the same. There's no trend to reverse and no momentum to exhaust. Save your attention for Dojis that appear after directional moves.
Skip it mid-trend without structure
A Doji in the middle of a strong trend, far from any support or resistance, is usually just a one-session pause. The trend resumes the next day as if nothing happened. Not every pause is a turning point.
Skip it on low volume
A Doji on below-average volume often means the market was simply inactive — not that buyers and sellers were fighting to a draw. Check relative volume before assigning meaning to the candle.
When to Pay Attention
The Dojis worth watching share three characteristics: they appear after effort, at a meaningful level, and are followed by confirmation.
After a strong, sustained trend
The Doji matters most when it breaks the pattern. If every recent session has been a strong directional close, and suddenly the market can't pick a side — that's new information. The dominant side is losing conviction.
At a key price level
A Doji at support, resistance, a moving average, or a Fibonacci level is the market telling you it's uncertain at a level that historically matters. That combination — indecision at structure — is where the highest-probability Doji setups form.
With confirmation from the next candle
The Doji itself is neutral. The next candle decides whether it was a rest stop or a turning point. A strong bullish close after a Doji in a downtrend suggests the bottom may be in. A strong bearish close after a Doji in an uptrend suggests the top may be forming.
With volume and momentum support
Elevated volume on the Doji means the stalemate was fought, not drifted into. Momentum indicators (RSI, MACD) approaching extremes add another layer of context. The more factors that align, the more meaningful the Doji becomes.
You're scanning the market and spot a Doji on a stock that's been trending sideways for two weeks. RSI is around 48. Volume is below average. The stock is far from any major moving average.
Is this Doji worth investigating further?
Reading the Doji in Context
Three lenses decide whether a Doji is a signal or noise: volume, structure, and momentum. Each gets its own dedicated guide; this is the quick orientation.
Volume — was the stalemate fought or drifted into? A Doji on heavy volume means buyers and sellers both showed up and fought to a draw — genuine disagreement. A Doji on light volume often means nobody cared enough to move price. Same shape, completely different meaning. Read the Candlesticks + Volume guide →
Structure — where on the chart did the Doji form? A Doji at support reads bullish — sellers couldn't break through. The same Doji at resistance reads bearish — buyers couldn't break through. A Doji in open space, far from any level, is usually just a pause in the trend. Read the Candlesticks + Moving Averages guide →
Momentum — is the dominant side stretched or just resting? A Doji when RSI is at an extreme (below 30 or above 70) is the side that was pushing hard finally running out of steam. A Doji when RSI is already flat (around 50) just confirms what you already knew: the market is directionless. Read the Candlesticks + RSI guide →
Pattern tells me where to look, context tells me whether to act.
Seeing the Doji in Action: $AON
Here's what a meaningful Doji looks like in practice — one that passes every filter and actually leads somewhere.
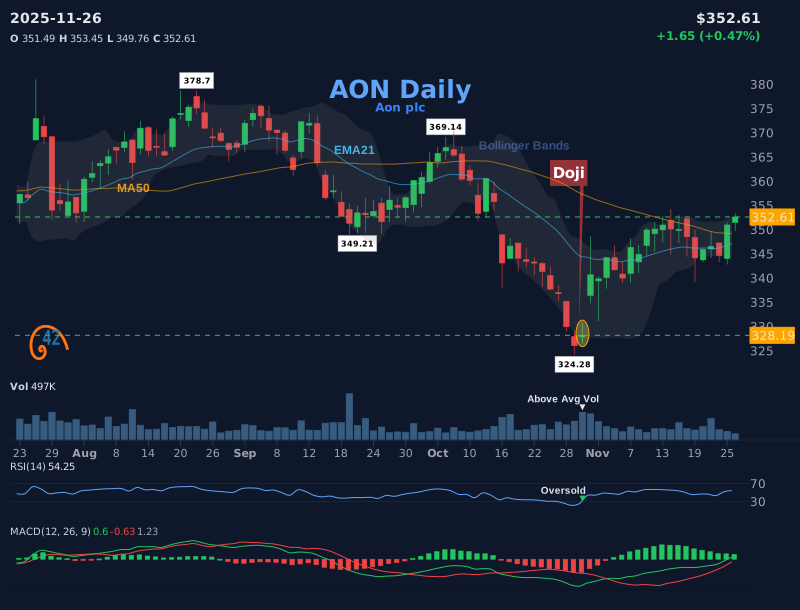
Before the Doji. Aon ($AON) had been declining steadily from an early October peak near $369 to the ~$324 area by late October — weeks of red candles, lower closes, sellers firmly in control. RSI sat near oversold.
The Doji prints. By late October, on elevated volume, open and close converge. After weeks of one-sided selling, the market suddenly couldn't pick a direction. The stalemate — at this point in the decline — was the signal that something had shifted.
The next session. Aon gapped up over the Doji's entire range — buyers didn't just follow through, they leaped over it. That's strong confirmation the selling pressure had broken.
Why this one passed every filter. Strong prior trend (weeks of decline), meaningful level (~$324 support area), elevated volume (the stalemate was fought), momentum at an extreme (RSI near oversold).
Common Doji Trading Mistakes
The Doji is the most over-traded pattern in candlestick analysis. Because it's easy to spot and appears frequently, traders assign meaning to Dojis that are just noise. Most Doji mistakes come from trading too many of them.
See a Doji after two down days, assume the bottom is in.
A Doji only matters after a strong, sustained trend — not a two-day dip. Without real directional pressure to exhaust, the Doji is meaningless.
A Doji appeared while price was chopping — the breakout must be imminent.
Consolidations manufacture Dojis constantly; they reflect the range, not a coming move. The Doji earns attention only when it interrupts directional price action, not when it echoes indecision that was already there.
The Doji is the signal — buy now.
The Doji is a question, not an answer. The next candle's close tells you which side won. Trading the Doji itself is trading a coin flip.
The shape is what matters. The number of contracts that traded behind it is irrelevant.
Two identical-looking Dojis can mean opposite things depending on who showed up. Heavy participation turns the candle into a documented standoff; thin tape turns it into a quiet afternoon. Always glance at rVol before assigning weight.
A Doji in a strong trend means the trend is over.
Strong trends often produce mid-trend pauses that look like Dojis. The trend resumes the next day. Don't confuse a rest stop with a destination.
- A Doji is a question, not an answer — it signals indecision, not direction
- Most Dojis should NOT be traded — filter for strong prior trend, meaningful level, and volume
- The next candle resolves the Doji's ambiguity — wait for confirmation before acting
- High volume means the stalemate was fought; low volume means nobody showed up
- Dojis in sideways markets are noise — indecision inside indecision teaches nothing
- The Doji family (Classic, Long-Legged, Dragonfly, Gravestone) shares the stalemate but the shadow placement tells different stories
Frequently Asked Questions
What is a Doji candlestick pattern?
A Doji forms when the open and close are nearly identical, creating a candle with little to no body. It signals indecision — neither buyers nor sellers could hold control by the close. It does not predict direction on its own; context and the next candle decide what it means.
Is a Doji bullish or bearish?
Neither on its own. A Doji is neutral — it signals indecision. A Doji after a downtrend at support leans bullish; after an uptrend at resistance, bearish. The shape is identical in both cases; the prior trend and price level determine direction, and the next candle's close confirms it.
How do you trade a Doji?
Wait for the next candle to confirm direction. A strong bullish close after a Doji in a downtrend suggests a reversal. A bearish close after a Doji in an uptrend suggests sellers are taking over. Trading the Doji itself, without confirmation, is the most common mistake.
What is the difference between a Doji and a Spinning Top?
Both signal indecision, but a Doji has virtually no body (open ≈ close) while a Spinning Top has a small but visible body. The Spinning Top shows a slight lean toward one side; the Doji shows perfect balance. A Doji is the more neutral of the two signals.
What are the different types of Doji?
The four main variants are: Classic Doji (shadows both sides), Long-Legged Doji (extremely wide range, same stalemate), Dragonfly Doji (long lower shadow, close at the high), and Gravestone Doji (long upper shadow, close at the low). Each has a slightly different implication based on where the shadow falls.
Why do Dojis fail so often?
Because most traders don't filter them. Dojis appear frequently — in ranges, mid-trend, on low volume — and most of those carry no meaning. The ones that matter appear after strong trends, at key levels, on elevated volume, and are followed by confirmation. The filter is everything.
The Bottom Line
The Doji teaches the hardest lesson in trading: sometimes the right move is to do nothing.
When the market can't decide, you shouldn't decide for it. The Doji is an invitation to observe — to watch the next candle, check the volume, note the level, and wait for the market to show its hand. Traders who learn that discipline avoid the false signals that trap everyone else.
The best Doji trades are the ones you don't take — the noisy, mid-range, low-volume Dojis that look like signals but lead nowhere. And when a real one appears — after a sustained trend, at a meaningful level, on genuine volume — you'll know it, because everything else has been filtered out.
Our 42Fibonacci Scanner checks for these conditions automatically across 3,000+ stocks.
Find Doji setups in the scanner →In this guide
'%3e%3crect%20width='240'%20height='240'%20fill='%23FF7A00'%3e%3c/rect%3e%3cg%20transform='matrix(0.07095%200%200%20-0.07095%2015%20220.748)'%20fill='%23FFFFFF'%20stroke='none'%3e%3cpath%20d='M1365%202583%20c-628%20-81%20-1087%20-602%20-1111%20-1258%20-9%20-231%2023%20-399%20111%20-580%20207%20-427%20651%20-631%20900%20-414%20313%20274%2067%20875%20-305%20744%20-177%20-63%20-242%20-307%20-110%20-418%2098%20-83%20230%20-43%20230%2069%200%2047%20-5%2051%20-34%2029%20-55%20-42%20-117%204%20-100%2073%2020%2082%20131%20108%20196%2046%2074%20-71%20100%20-207%2058%20-316%20-65%20-174%20-281%20-266%20-437%20-185%20-146%2075%20-276%20272%20-340%20515%20-34%20128%20-39%20396%20-10%20532%20103%20479%20422%20837%20856%20958%20143%2040%20402%2039%20536%20-1%20434%20-132%20743%20-484%20841%20-959%2019%20-91%2024%20-295%2011%20-413%20-11%20-91%20-2%20-80%2029%2041%2080%20312%2017%20689%20-163%20972%20-253%20397%20-715%20623%20-1158%20565z'%3e%3c/path%3e%3cpath%20d='M2035%201809%20c-63%20-18%20-121%20-85%20-140%20-161%20-6%20-23%20-3%20-27%2027%20-33%2018%20-3%2040%20-9%2050%20-11%2011%20-3%2018%203%2023%2023%2025%20113%20189%20126%20225%2018%2031%20-93%20-7%20-155%20-243%20-409%20-86%20-92%20-88%20-96%20-85%20-138%20l3%20-43%20223%20-2%20222%20-3%200%2045%20c0%2025%20-1%2048%20-2%2053%20-3%207%20-22%208%20-191%2011%20l-98%201%2075%2083%20c167%20181%20210%20263%20204%20379%20-8%20148%20-140%20232%20-293%20187z'%3e%3c/path%3e%3cpath%20d='M1579%201733%20c-29%20-43%20-106%20-154%20-171%20-247%20-107%20-152%20-118%20-173%20-118%20-212%20l0%20-44%20173%20-2%20172%20-3%203%20-88%203%20-89%2052%204%20c32%202%2052%208%2053%2016%201%206%202%2046%203%2087%20l1%2075%2045%200%2045%200%200%2050%200%2050%20-45%200%20-45%200%20-1%20173%20c-1%2094%200%20202%201%20240%20l2%2067%20-60%200%20-60%200%20-53%20-77z%20m58%20-400%20c-3%20-2%20-52%20-2%20-110%20-1%20l-105%203%20107%20155%20106%20155%203%20-154%20c1%20-85%201%20-156%20-1%20-158z'%3e%3c/path%3e%3c/g%3e%3c/g%3e%3c/svg%3e)
42Fibonacci