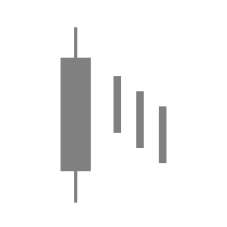
Candlesticks + Moving Averages
See live examples in scanner →A Hammer forms right on the rising 50-day average, where buyers have been stepping in for months. The same Hammer forms a week later in empty space — no level, no trend line, nothing around it. Same candle. Two entirely different setups.
That difference is what moving averages reveal.
Candlesticks tell you what happened in the session. Moving averages tell you where that session sits on the map. Not entry signals. Not a system. Structural context — the thing that decides whether a pattern you just spotted actually matters.
Candlesticks describe what happened. Moving averages explain where it happened. Together, they tell you whether it matters.
What Are Moving Averages
A moving average is just the average closing price over a set number of sessions, recalculated every day. Plot it on a chart and you get a smooth line that filters out the day-to-day noise and shows you the underlying direction.
There are two types you need to know:
Simple Moving Average (SMA) weights every session equally. The 50-day SMA is the average of the last 50 closes — each one counts the same. It's straightforward and widely followed.
Exponential Moving Average (EMA) gives more weight to recent sessions. This makes it more responsive to current price action — it turns faster when the trend shifts. The tradeoff is that it's also more reactive to noise.
For candlestick context, three moving averages cover everything you need:
EMA 21 — the speed line
Tracks the short-term trend. In an active move, price tends to stay near the 21 EMA. When it pulls back to this line and holds, the trend is still healthy. When it breaks, the short-term momentum is shifting.
MA 50 — the swing reference
The most common pullback reference for intermediate trends. Swing traders watch this line closely. A stock holding above a rising MA 50 is structurally healthy. A break below it gets attention.
MA 200 — the regime boundary
The dividing line between long-term uptrends and downtrends. Institutional investors and fund managers use this as a regime filter. Price above a rising MA 200 is a fundamentally different environment than price below a falling one.
What They Do and Don't Do
Moving averages are reference lines. They show you where structure is — where price has been trending, where the average buyer is positioned, where institutions are likely paying attention. That's valuable information.
But they are not decision-makers. A price touching the 50-day MA is not a buy signal. A price crossing below the 200-day MA is not automatically a sell signal. These are reference points — they tell you where you are, not what to do.
Think of it this way: a compass tells you which direction is north. It doesn't tell you whether to walk north. Moving averages work the same way — they orient you in the trend, but the trading decision still depends on price action, volume, and the pattern forming at that level.
Three Questions MAs Answer
Every time you spot a candlestick pattern, moving averages can answer three questions that the pattern alone can't:
Is this pattern trading with or against the trend?
A bullish Hammer above a rising MA 50 is trading with the intermediate trend — the structure supports the signal. A bullish Hammer below a falling MA 50 is fighting the trend. Both are valid patterns, but the odds are different. MAs make this obvious at a glance.
Is this pattern forming at a meaningful location?
A reversal pattern at a moving average — especially one that has held before — is forming where buyers or sellers have structural reasons to show up. A reversal pattern in empty space, far from any MA, has no structural anchor. Location is what separates a signal from a shape.
Is the structure itself turning?
When the MA 50 crosses above the MA 200, that's a Golden Cross — the intermediate trend is turning bullish relative to the long-term trend. When the MA 50 crosses below the MA 200, that's a Death Cross. These structural shifts change the backdrop for every candlestick pattern on the chart.
None of these questions generate trade signals on their own. But answering them before you act on a candlestick pattern is the difference between trading with structural support and trading blind.
How MAs Add Context
Moving averages add context to candlestick patterns in two primary ways: structural support/resistance and holding or reclaiming structure.
Structural support and resistance. A rising MA acts as dynamic support — a floor that moves up with the trend. When price pulls back to a rising MA 50, that level carries weight because it represents the average price of the last 50 sessions in a stock that's been going up. Buyers who are positioned in the trend have structural reasons to defend that level.
A falling MA is the opposite — dynamic resistance. A ceiling that moves down with the trend. Rallies into a falling MA 50 often fail because the structure itself is working against recovery. The average buyer over the last 50 sessions is underwater and may sell into any rally to break even.
Holding vs. reclaiming structure. There's a difference between price holding above a moving average and price reclaiming a moving average after falling below it. Holding means the trend never broke — the pullback found buyers at the expected level. Reclaiming means the trend broke, but buyers fought their way back above it. Both are constructive, but a reclaim after a break is often a stronger signal because it shows buyers were willing to fight for that level even after it gave way.
Pattern tells me where to look, context tells me whether to act.
Real Example: How MA Context Transforms a Pattern
Here's a Bullish Harami on Hershey ($HSY) that printed exactly where the intermediate trend said buyers should show up — at a rising 50-day moving average.
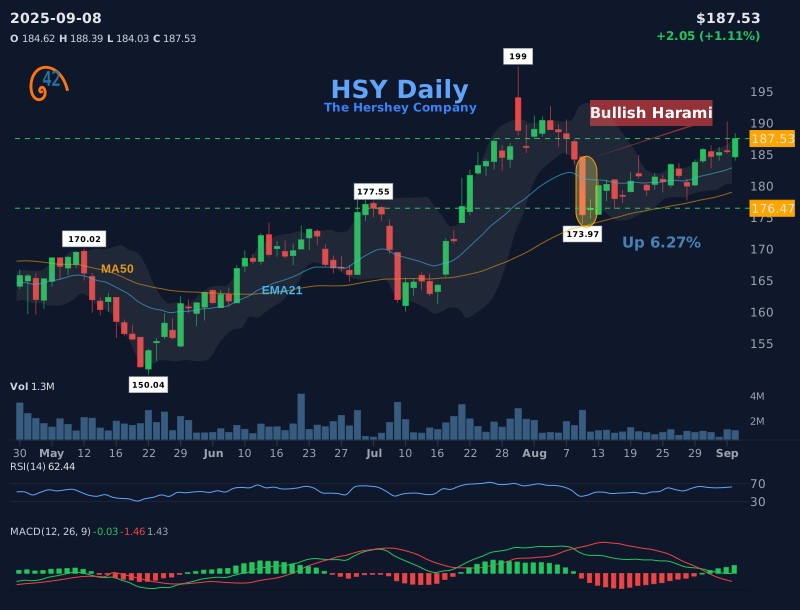
Before the Harami. $HSY had been trending higher through mid-2025 with the MA 50 rising steadily underneath price. In late July the stock pulled back — a normal correction within an uptrend. Sellers pushed it lower for several sessions, but never broke the MA 50.
The pattern prints. On August 13, 2025, a Bullish Harami formed right above the rising 50-day moving average. The first candle continued the pullback with a strong red close; the second sat entirely inside its body — a small green candle that said sellers had run out of steam.
What MA context added. The same Harami in empty space is a reasonable indecision-after-pullback signal. The Harami at a rising MA 50 is a high-quality setup — pullback in a confirmed uptrend, finding buyers exactly where structure said they'd show up.
Why this one was tradeable. Short-term pullback for the Harami to reverse (not in the middle of a trending move), MA 50 rising steadily underneath that pullback (the larger trend was still bullish), Harami formed right at the MA level (not 5% past it), and price held above the MA in the sessions that followed. Remove any one of those conditions and the setup is weaker.
Common Moving Average Mistakes
Moving averages are simple tools, but they're routinely misused. Most of these mistakes come from treating MAs as signals instead of context.
Price touched the 50-day MA — this is the exact support level. Buy right here.
Moving averages are zones, not lines. Price might undercut the MA by a few percent before buyers show up, or bounce a few points above it. React to the price action at the MA, not the touch itself.
The pattern looks textbook — that's enough, regardless of where the MAs are.
When all three MAs are falling and price is below all of them, the structural backdrop is bearish. A bullish pattern can still mark a major bottom — that's where reversals start — but the trend is against you. Demand more: volume confirmation, oversold momentum, a clear support level. Without that confluence, you're catching a falling knife.
Price just crossed above the 50-day MA — that's enough, I'm buying.
A price crossing above an MA tells you the structural backdrop is shifting, not that this is a good entry. Wait for an actual pattern — a Bullish Engulfing, a Hammer, a clean retest of the MA — to give you a defined entry price and a clear stop level. The cross alone leaves you with neither.
Price is at the 50-day MA — doesn't matter if it's rising or falling, it's still support.
A rising MA 50 is support — the trend is up and the average buyer is profitable. A falling MA 50 is resistance — the trend is down and the average buyer is underwater. Direction matters as much as proximity.
Plot the 10, 20, 21, 50, 100, 150, and 200-day MAs so you never miss anything.
Three MAs — EMA 21, MA 50, MA 200 — cover short, intermediate, and long-term context. Adding more creates noise, not clarity. If every price level is near "a moving average," none of them are meaningful.
- Moving averages are context tools, not trading signals — they tell you where you are, not what to do
- Three MAs cover everything: EMA 21 (short-term), MA 50 (intermediate), MA 200 (long-term regime)
- A rising MA is support; a falling MA is resistance — direction matters as much as proximity
- The best candlestick setups form at moving averages that are trending in your favor
- Golden Cross (MA 50 above MA 200) and Death Cross (MA 50 below MA 200) define the structural regime
- MAs are zones, not exact lines — wait to see if price actually holds or bounces at the MA before treating it as support, not just because price touched the line
- A pattern at a meaningful MA is a setup; the same pattern in empty space is just a shape
A Hammer forms 3% below a falling 50-day moving average. The MA 200 is also above price and declining. A trader argues that the Hammer is at support because it's near the MA 50.
Is this pattern forming at support?
Frequently Asked Questions
What moving averages should I use with candlestick patterns?
Three moving averages cover the essential context: the 21-day EMA for short-term trend and pullback context, the 50-day MA for intermediate structure, and the 200-day MA for the long-term regime. These three answer different questions without overcrowding the chart or creating redundant signals.
What is the difference between SMA and EMA?
A Simple Moving Average (SMA) weights every session equally. An Exponential Moving Average (EMA) gives more weight to recent sessions, making it more responsive to current price action. The EMA turns faster when the trend shifts but is also more reactive to noise in sideways markets.
What is a Golden Cross?
A Golden Cross occurs when the 50-day moving average crosses above the 200-day moving average. It signals that the intermediate trend is turning bullish relative to the long-term trend — a structural shift that changes the backdrop for candlestick patterns. It is context, not a trading signal by itself.
Can moving averages be used as buy or sell signals?
Moving averages are best used as context, not signals. Price touching the 50-day MA is not a buy signal — it's information about where you are in the trend. Combine the MA context with a candlestick pattern and volume confirmation for an actual trading decision. Signals require confirmation.
Does the direction of a moving average matter?
Yes — direction matters as much as proximity. A rising MA acts as dynamic support because the trend is up and the average buyer is profitable. A falling MA acts as resistance because the trend is down and the average buyer is underwater. Same MA, opposite meaning depending on slope.
How do I know if price is "holding" vs. "reclaiming" a moving average?
Holding means price pulled back to the MA but never closed below it — the trend stayed intact. Reclaiming means price fell below the MA and then fought its way back above it. Both are constructive, but a reclaim is often stronger because it shows buyers were willing to fight.
The Bottom Line
Moving averages don't make patterns work. They help you avoid trading the ones that shouldn't matter.
A Hammer is a Hammer whether it forms at rising MA support or in empty space. But the one at rising support has structural backing — a reason why buyers would show up at that level, a trend that says the path of least resistance is higher, a moving average that institutional money actually watches.
Adding MA context to your candlestick analysis doesn't make it more complicated. It makes it more selective. And selectivity — knowing which patterns to trade and which to skip — is what separates traders who are consistent from traders who are busy.
Our 42Fibonacci Scanner surfaces moving average context alongside every candlestick pattern it detects — so you can see the structural backdrop without building the chart yourself.
See MA context in the scanner →In this guide
'%3e%3crect%20width='240'%20height='240'%20fill='%23FF7A00'%3e%3c/rect%3e%3cg%20transform='matrix(0.07095%200%200%20-0.07095%2015%20220.748)'%20fill='%23FFFFFF'%20stroke='none'%3e%3cpath%20d='M1365%202583%20c-628%20-81%20-1087%20-602%20-1111%20-1258%20-9%20-231%2023%20-399%20111%20-580%20207%20-427%20651%20-631%20900%20-414%20313%20274%2067%20875%20-305%20744%20-177%20-63%20-242%20-307%20-110%20-418%2098%20-83%20230%20-43%20230%2069%200%2047%20-5%2051%20-34%2029%20-55%20-42%20-117%204%20-100%2073%2020%2082%20131%20108%20196%2046%2074%20-71%20100%20-207%2058%20-316%20-65%20-174%20-281%20-266%20-437%20-185%20-146%2075%20-276%20272%20-340%20515%20-34%20128%20-39%20396%20-10%20532%20103%20479%20422%20837%20856%20958%20143%2040%20402%2039%20536%20-1%20434%20-132%20743%20-484%20841%20-959%2019%20-91%2024%20-295%2011%20-413%20-11%20-91%20-2%20-80%2029%2041%2080%20312%2017%20689%20-163%20972%20-253%20397%20-715%20623%20-1158%20565z'%3e%3c/path%3e%3cpath%20d='M2035%201809%20c-63%20-18%20-121%20-85%20-140%20-161%20-6%20-23%20-3%20-27%2027%20-33%2018%20-3%2040%20-9%2050%20-11%2011%20-3%2018%203%2023%2023%2025%20113%20189%20126%20225%2018%2031%20-93%20-7%20-155%20-243%20-409%20-86%20-92%20-88%20-96%20-85%20-138%20l3%20-43%20223%20-2%20222%20-3%200%2045%20c0%2025%20-1%2048%20-2%2053%20-3%207%20-22%208%20-191%2011%20l-98%201%2075%2083%20c167%20181%20210%20263%20204%20379%20-8%20148%20-140%20232%20-293%20187z'%3e%3c/path%3e%3cpath%20d='M1579%201733%20c-29%20-43%20-106%20-154%20-171%20-247%20-107%20-152%20-118%20-173%20-118%20-212%20l0%20-44%20173%20-2%20172%20-3%203%20-88%203%20-89%2052%204%20c32%202%2052%208%2053%2016%201%206%202%2046%203%2087%20l1%2075%2045%200%2045%200%200%2050%200%2050%20-45%200%20-45%200%20-1%20173%20c-1%2094%200%20202%201%20240%20l2%2067%20-60%200%20-60%200%20-53%20-77z%20m58%20-400%20c-3%20-2%20-52%20-2%20-110%20-1%20l-105%203%20107%20155%20106%20155%203%20-154%20c1%20-85%201%20-156%20-1%20-158z'%3e%3c/path%3e%3c/g%3e%3c/g%3e%3c/svg%3e)
42Fibonacci