A stock has been sliding for weeks. Each session, sellers close it lower. Small red candles, lower lows — the kind of grind that wears traders down.
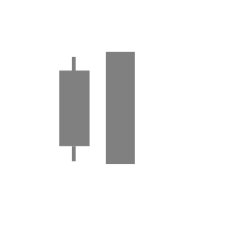
Then one day, the market opens lower — sellers pressing again — and reverses. Buyers don't just push back. They take the entire session, and then the prior one too. By the close, a single green candle has wrapped the previous red candle. That's a Bullish Engulfing — one day of buying that erases one day of selling.
Most reversal patterns whisper. The Engulfing shouts. But only if you know what to look for: the bodies engulf each other, not the wicks.
Every pattern before this was a hint. The Engulfing is a statement.
What Makes an Engulfing Pattern
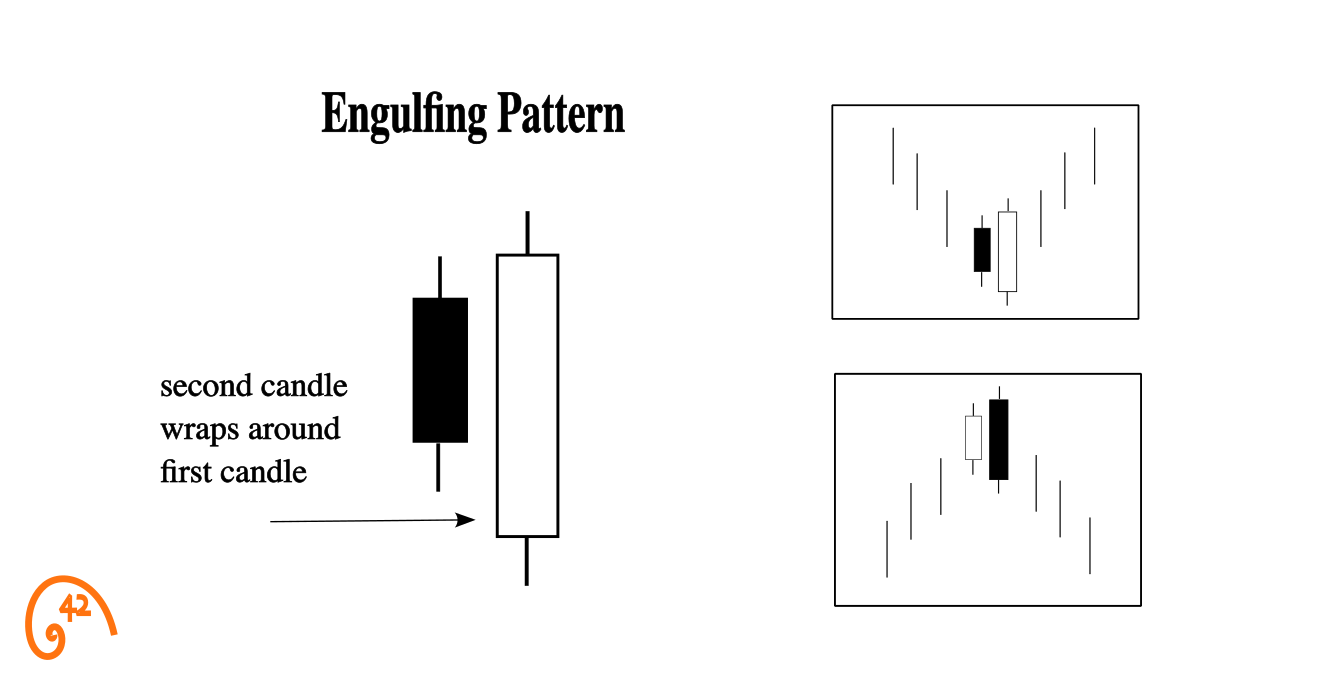
The Engulfing Pattern is a two-candle reversal where the second candle's body completely wraps the first candle's body. One session in the trend's direction, followed by one session in the opposite direction so strong it erases the previous day entirely.
After a downtrend, that's a Bullish Engulfing — a red continuation candle followed by a green one that opens below the prior close and closes above the prior open. After an uptrend, the mirror — a green candle wrapped by a red one — is a Bearish Engulfing.
The name is literal: the second candle engulfs the first.
Body vs. Wicks: The Rule That Matters
This is the single most important distinction in the Engulfing pattern, and the one most often ignored: the second candle's body must engulf the first candle's body. Not the wicks — the body.
Why? Because the body represents the open-to-close range — where the market decided to settle. The wicks represent intraday exploration that was rejected. When the second candle's body wraps the first candle's body, it means the session's conviction overwhelmed the prior session's conviction. That's a control shift.
When only the wicks overlap but the bodies don't fully wrap, you're looking at intraday volatility, not a decisive takeover. The wicks touched extreme prices that couldn't hold. The body is what held.
How Strong Is the Engulfing?
Two engulfings can both pass the body-engulfs-body rule and still send very different signals. The difference is proportion: the smaller the first candle and the larger the second, the more decisive the takeover.
A small red body wrapped by a huge green body says one thing — sellers were finishing weak, then buyers showed up with overwhelming force. That's a power transfer with conviction. Two roughly equal candles where the second just barely wraps the first say something quieter: a takeover, technically, but not a runaway one.
A useful heuristic: the second body should be meaningfully larger than the first — and ideally large compared to recent candles too. A common rule of thumb is at least 2x the first body, but markets vary in volatility, so treat the ratio as a guide, not a requirement. Equal-sized engulfings still count as valid, but treat them as weaker — needing more support from volume, structure, and confirmation.
How a Bullish Engulfing Forms
Every two-candle pattern is a compressed story told across two sessions. The Bullish Engulfing's story is about a complete power transfer — from sellers to buyers — in a single day.
"Another down day. The trend continues. No reason to fight it."
The first candle is bearish — a red body that continues the decline. It doesn't need to be dramatic. It's simply the trend doing what trends do. Sellers are in control. Buyers are on the sidelines.
"It's gapping down? Even weaker than yesterday. More sellers."
The second session opens below the first candle's close — a gap down. At this point, bears feel vindicated. The downtrend looks like it's accelerating. But this gap is also where the trap is set.
"Wait — it rallied through yesterday's entire range? That's not a bounce. That's a takeover."
Buyers show up with force. Price climbs through the entire previous day's body and closes above it. The session that started as weakness ended as overwhelming strength. One day of buying erased one day of selling — completely.
The psychology is what makes this pattern powerful. Traders who sold on day one — and those who shorted on the gap down at day two's open — are now underwater. In one session, the entire narrative flipped. That kind of decisive action forces repositioning, which can fuel further upside.
This is what separates the Engulfing from single-candle patterns. The Hammer shows that sellers couldn't hold the low. The Engulfing shows that buyers overwhelmed the sellers. One is a crack; the other is a statement.
Mirroring for the Bearish Engulfing: Flip the colors and the trend. Session one is a green candle in an uptrend — bulls feel comfortable, the rally has been working.
Session two gaps up; momentum traders chase, expecting another leg higher. Then sellers take over. By the close, a red body has wrapped the green one entirely.
Anyone who bought yesterday is underwater. Anyone who chased the gap-up is deeply underwater. Stops start triggering, momentum traders flip short, and the narrative shifts from "rally continuing" to "this might be the top."
Engulfing vs. Lookalikes
The Bullish Engulfing has close relatives that share the two-candle structure but carry different weight. Confusing them is common — and costly.
- Large green body fully wraps the prior red body
- Decisive one-session reversal
- The inverse: small candle inside a large prior candle
- Weaker signal — contraction, not conviction
- Same concept but partial — closes above midpoint
- Moderate signal — conviction shown but not complete
The Piercing Pattern is the one that causes the most confusion. It looks similar — bullish second candle after a bearish first — but the second candle closes above the midpoint of the first body without fully engulfing it. It's a partial takeover. The Engulfing is the complete version.
The Harami is the structural opposite: instead of the second candle engulfing the first, the second candle fits inside the first. Where the Engulfing shows expansion and conviction, the Harami shows contraction and hesitation.
Bullish vs Bearish Engulfing
The Bullish and Bearish Engulfing are mirror patterns — same body-engulfs-body structure, opposite trend setups.
The two to distinguish:
Bullish Engulfing
Appears after a downtrend. Sellers had been in control — multiple sessions of lower closes — then the trend cracks. A green body wraps the prior red body completely. One session of buying erases one session of selling.
Bearish Engulfing
Appears after an uptrend. Buyers had been in control — multiple sessions of higher closes — then the trend cracks. A red body wraps the prior green body completely. One session of selling erases one session of buying.
How to Trade the Engulfing Pattern
The Engulfing Pattern is visually dramatic, which makes it tempting to trade every one. Don't. Here's the process that separates disciplined entries from impulse trades.
Confirm a real prior trend exists
The Engulfing is a reversal pattern — it needs something to reverse. Look for a sustained move over multiple sessions: lower highs and lower lows for a Bullish Engulfing, higher highs and higher lows for a Bearish Engulfing. An engulfing after a brief move inside a range is not a reversal setup.
Check for structural confluence
The highest-probability engulfing patterns form at levels where the opposing side has reason to show up: support or resistance, moving averages, Fibonacci retracement zones, or the edges of a channel. An engulfing in empty space with no nearby structure is riskier.
Verify the body rule
Before anything else, confirm that the second candle's body fully wraps the first candle's body. Not the wicks — the body. If it's close but not complete, it might be a Piercing Pattern instead (weaker signal).
Evaluate volume on the engulfing candle
The engulfing candle should carry significantly more volume than the first candle. That volume difference is what separates a genuine conviction shift from a one-day bounce. If both candles have similar volume, the "engulfing" carries less weight.
Enter on the close or next open, with a defined stop
If the pattern passes all filters, enter on the engulfing candle's close or the following session's open. Your stop goes beyond the engulfing candle's extreme — below the low for a Bullish Engulfing, above the high for a Bearish Engulfing. If price breaks past it, the takeover failed.
You see a candle that opened below yesterday's close and rallied hard, closing above yesterday's open. It looks like a Bullish Engulfing. But when you check carefully, the second candle's body only covers about 90% of the first candle's body — it doesn't fully engulf it.
Is this a valid Bullish Engulfing pattern?
Reading the Engulfing Pattern in Context
Three lenses decide whether an Engulfing is a real takeover or one decisive session with nothing behind it: volume, structure, and momentum. Each gets its own dedicated guide; this is the quick orientation.
Volume — was the engulfing fought or drifted into? The engulfing candle's volume should dwarf the first candle's. This isn't optional — it's the difference between buyers overwhelming sellers and buyers quietly outnumbering them on a thin tape. Two candles with similar volume mean the "takeover" was a relabeling, not a regime change. Read the Candlesticks + Volume guide →
Structure — where on the chart did the engulfing land? A Bullish Engulfing at prior support, the 50-day or 200-day moving average, or a Fibonacci retracement is buyers showing up where they've shown up before — the location does half the work. The same engulfing in open space has no structural anchor; its reversal has to generate momentum from scratch. Read the Candlesticks + Moving Averages guide →
Momentum — is the dominant side stretched or just resting? A Bullish Engulfing while RSI is below 30 catches sellers running out of fuel; the takeover lands when the other side is already short of breath. Bullish RSI divergence (price makes a new low but RSI doesn't) makes the read stronger. An engulfing in the middle of a healthy RSI range is a one-day event without the physics behind it. Read the Candlesticks + RSI guide →
Pattern tells me where to look, context tells me whether to act.
Seeing the Engulfing in Action
We're still collecting real-world chart examples that meet our standards for this guide. In the meantime, the trade section above walks through what to look for in a real setup.
Common Engulfing Pattern Trading Mistakes
The Engulfing Pattern is visually satisfying — one large candle swallowing the prior one feels decisive. That visual satisfaction is exactly what leads traders to overtrade it. Here are the most common mistakes.
The wicks overlap, so it counts as an engulfing pattern.
Only the bodies matter. The second candle's real body (open to close) must fully contain the first candle's real body. Wicks are noise — they show prices that were rejected, not where the market decided to settle.
The second candle barely covers the first by a tick — close enough.
A meaningful engulfing shows decisive action. If the second candle barely wraps the first, the "takeover" is marginal at best. Look for clear, visible engulfing where the size difference is obvious.
Big candle swallowing a smaller one — that's a reversal, period, regardless of what led into it.
A reversal implies something to turn. An engulfing inside a sideways range, or following a one-day pullback inside the prevailing trend, isn't flipping anything. Always identify the trend the pattern is supposedly ending before accepting the signal.
It's a textbook engulfing — location is just a bonus.
A pattern at a level the opposing side has historically defended is leveraging structure that already exists. The same pattern floating in the middle of nowhere has to generate its own momentum from scratch. The odds are visibly different even when the shape is identical.
Place the stop just beyond the prior candle's close — tight and efficient.
The engulfing candle's extreme is the invalidation — its low for a Bullish Engulfing, its high for a Bearish Engulfing. That extreme can be well past the prior candle due to the gap. If that makes the stop too wide for your position size, reduce the position — don't move the stop.
- The Bullish Engulfing is a two-candle pattern where the second session completely overwhelms the first — a decisive control shift
- Body engulfs body. Not wicks. The real body of the second candle must fully wrap the real body of the first. This is the defining rule
- Context determines quality — an engulfing at support with volume conviction is a setup; an engulfing in open space is a question mark
- Volume on the engulfing candle should significantly exceed the first candle's volume — one-sided participation is what makes the shift real
- The wider engulfing candle means wider stops — account for this in position sizing before you enter, not after
- Don't confuse it with a Piercing Pattern (partial) or a wick-only overlap (not valid) — the full body wrap is what separates the Engulfing from its lookalikes
Frequently Asked Questions
What is a Bullish Engulfing candlestick pattern?
A Bullish Engulfing is a two-candle reversal pattern that appears after a downtrend. The first candle is bearish. The second is bullish and its body fully wraps the first candle's body — opening below the prior close and closing above the prior open. It signals that buyers overwhelmed sellers in one session.
What is a Bearish Engulfing candlestick pattern?
A Bearish Engulfing is the mirror of the Bullish Engulfing, appearing after an uptrend. The first candle is bullish. The second is bearish and its body fully wraps the first — opening above the prior close and closing below the prior open. It signals that sellers overwhelmed buyers in a single decisive session.
Does the engulfing candle need to engulf the wicks too?
No. Only the body (open-to-close range) of the second candle needs to fully contain the body of the first candle. The wicks represent intraday extremes that were rejected. Body engulfing is what defines the pattern — wick engulfing alone does not qualify as a valid Engulfing signal.
What is the difference between a Bullish Engulfing and a Piercing Pattern?
Both are two-candle bullish patterns after a decline. The difference is degree. The Bullish Engulfing's second candle closes above the first candle's open — fully wrapping the body. The Piercing Pattern's second candle closes above the midpoint but below the open. The Engulfing is the stronger signal.
How important is volume on the engulfing candle?
Very. The engulfing candle should carry significantly more volume than the first candle. That volume difference confirms genuine conviction — real money shifted sides. If both candles have similar volume, the "engulfing" is a visual pattern without the participation to back it up and is far less reliable.
Where should I place my stop on a Bullish Engulfing trade?
Below the low of the engulfing candle. Because the engulfing candle often opens with a gap down, its low can be well below the prior day's range. This means the stop may be wider than expected — account for this in your position sizing before entering the trade.
Can a Bullish Engulfing fail?
Yes — like any pattern. The most common reasons are: no real downtrend to reverse, no structural support underneath the pattern, low volume on the engulfing candle, or the market overwhelms the signal with macro or news-driven selling. Context filters reduce failures significantly but never eliminate them.
The Bottom Line
The Engulfing Pattern teaches something the single-candle patterns don't: reversals can happen in one overwhelming session, not gradually.
When one session completely swallows the prior session — green over red after a downtrend, red over green after an uptrend — the market is telling you something unambiguous. One side had control. The other side took it — not by chipping away, but by taking over entirely. That's what the engulfing body represents: a decisive shift that forces repositioning.
But decisiveness without context is just volatility. The Engulfing earns its weight when it forms after a real prior trend, at a meaningful level, with volume conviction on the second candle. Stack those conditions, and you're looking at one of the clearest two-candle reversal signals in candlestick analysis.
Our 42Fibonacci Scanner checks for these conditions automatically across 3,000+ stocks.
Find Engulfing setups in the scanner →In this guide
'%3e%3crect%20width='240'%20height='240'%20fill='%23FF7A00'%3e%3c/rect%3e%3cg%20transform='matrix(0.07095%200%200%20-0.07095%2015%20220.748)'%20fill='%23FFFFFF'%20stroke='none'%3e%3cpath%20d='M1365%202583%20c-628%20-81%20-1087%20-602%20-1111%20-1258%20-9%20-231%2023%20-399%20111%20-580%20207%20-427%20651%20-631%20900%20-414%20313%20274%2067%20875%20-305%20744%20-177%20-63%20-242%20-307%20-110%20-418%2098%20-83%20230%20-43%20230%2069%200%2047%20-5%2051%20-34%2029%20-55%20-42%20-117%204%20-100%2073%2020%2082%20131%20108%20196%2046%2074%20-71%20100%20-207%2058%20-316%20-65%20-174%20-281%20-266%20-437%20-185%20-146%2075%20-276%20272%20-340%20515%20-34%20128%20-39%20396%20-10%20532%20103%20479%20422%20837%20856%20958%20143%2040%20402%2039%20536%20-1%20434%20-132%20743%20-484%20841%20-959%2019%20-91%2024%20-295%2011%20-413%20-11%20-91%20-2%20-80%2029%2041%2080%20312%2017%20689%20-163%20972%20-253%20397%20-715%20623%20-1158%20565z'%3e%3c/path%3e%3cpath%20d='M2035%201809%20c-63%20-18%20-121%20-85%20-140%20-161%20-6%20-23%20-3%20-27%2027%20-33%2018%20-3%2040%20-9%2050%20-11%2011%20-3%2018%203%2023%2023%2025%20113%20189%20126%20225%2018%2031%20-93%20-7%20-155%20-243%20-409%20-86%20-92%20-88%20-96%20-85%20-138%20l3%20-43%20223%20-2%20222%20-3%200%2045%20c0%2025%20-1%2048%20-2%2053%20-3%207%20-22%208%20-191%2011%20l-98%201%2075%2083%20c167%20181%20210%20263%20204%20379%20-8%20148%20-140%20232%20-293%20187z'%3e%3c/path%3e%3cpath%20d='M1579%201733%20c-29%20-43%20-106%20-154%20-171%20-247%20-107%20-152%20-118%20-173%20-118%20-212%20l0%20-44%20173%20-2%20172%20-3%203%20-88%203%20-89%2052%204%20c32%202%2052%208%2053%2016%201%206%202%2046%203%2087%20l1%2075%2045%200%2045%200%200%2050%200%2050%20-45%200%20-45%200%20-1%20173%20c-1%2094%200%20202%201%20240%20l2%2067%20-60%200%20-60%200%20-53%20-77z%20m58%20-400%20c-3%20-2%20-52%20-2%20-110%20-1%20l-105%203%20107%20155%20106%20155%203%20-154%20c1%20-85%201%20-156%20-1%20-158z'%3e%3c/path%3e%3c/g%3e%3c/g%3e%3c/svg%3e)
42Fibonacci