
A stock has been bleeding for weeks. Sellers own every session. Then one morning buyers step in and drive price hard — a real rally, not a bounce. By the close, sellers have dragged it back down near the low. Small body at the bottom. Long upper shadow. On the tape, it looks like sellers won again.
That's an Inverted Hammer.
The close is misleading. The signal isn't who won the session — it's that buyers could push that hard at all after days of one-sided selling. The rally attempt is the tell.
The candle that doesn't look bullish might be the most important one on the chart. Learning to read it is what separates pattern recognition from real candlestick analysis.
What Makes an Inverted Hammer
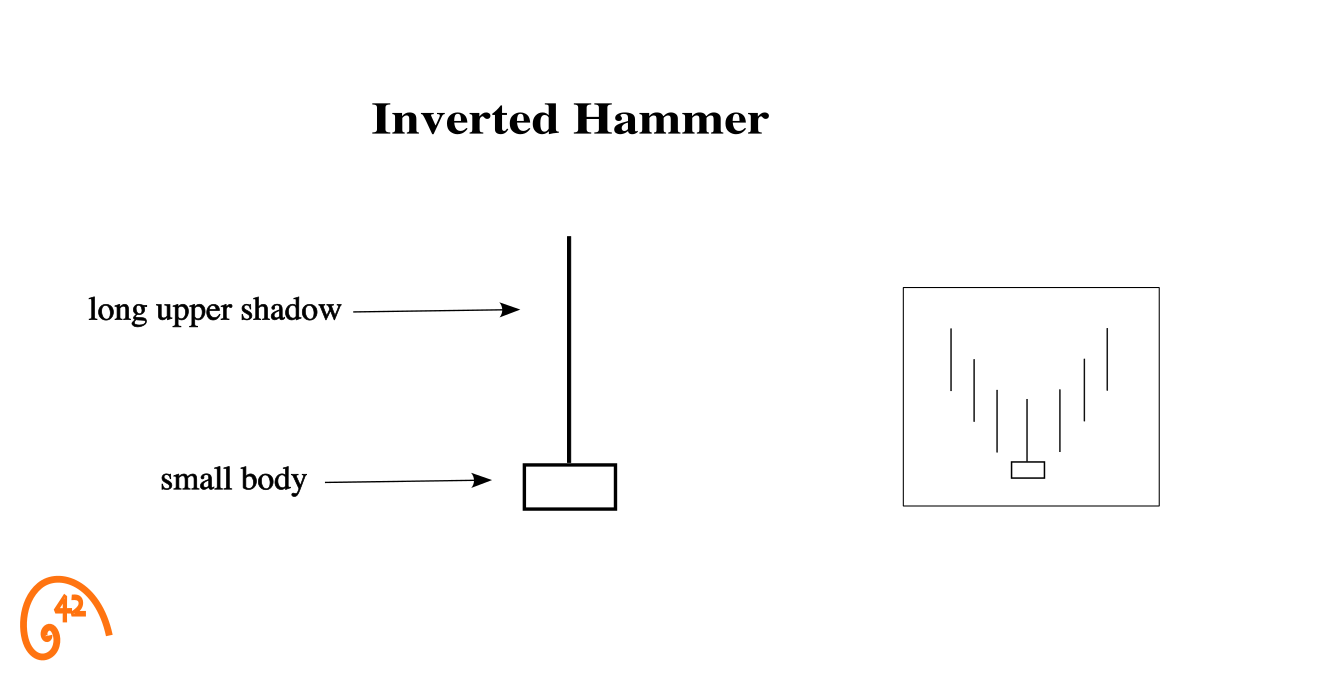
The Inverted Hammer is a single-candle pattern defined by its shape: a small real body near the bottom of the range and a long upper shadow — at least twice the body length.
The name comes from exactly what it looks like: a hammer flipped upside down, with the shadow forming the handle above the small body. Where a regular Hammer shows sellers failing to push lower, the Inverted Hammer shows buyers attempting to push higher — and sellers responding, but not enough to make new lows.
How an Inverted Hammer Forms
Every candlestick is a compressed story. The Inverted Hammer's story is about the first challenge to a downtrend — a test of strength from buyers who haven't been heard from in days.
"Wait — someone is actually buying. Price is moving up."
The session opens and, unexpectedly, buyers push price higher. For the first time in several sessions, there's real demand. Price climbs significantly from the open, creating what will become the long upper shadow.
"The bears aren't done. They're selling into every push."
Sellers respond to the rally attempt. They push price back down toward the open. The early gains evaporate. It looks like just another failed bounce — the kind that has been happening for days.
"They pushed it back down — but not to new lows. Something is different."
By the close, price finishes near the bottom of the range. Sellers won the session, technically. But here's what matters: they couldn't push price to new lows. Buyers showed up with enough force to change the dynamic, even if they couldn't hold the gains. That's the crack in the downtrend.
This is where the Inverted Hammer teaches you something the Hammer doesn't: not every signal looks like a win. The Hammer is a clear rejection — sellers tried and failed, price closed near the high. Easy to read. The Inverted Hammer is a challenge — buyers tried and got pushed back, but they proved they exist. That's harder to read, and that's why most traders miss it.
Think of it this way: the Hammer answers "Can sellers still push lower?"with a definitive no. The Inverted Hammer answers "Are buyers willing to fight?" with a surprising yes. Both are valuable — but the Inverted Hammer requires more patience to confirm, because the candle itself is ambiguous.
Inverted Hammer vs. Lookalikes
The Inverted Hammer shares its shape with patterns that carry completely different messages. The candle looks the same — a small body at the bottom, a long upper shadow. The difference is entirely about where it appears.
- Long upper shadow, small body near the bottom
- After a downtrend — buyers attempted a rally
- Identical shape to an Inverted Hammer
- After an uptrend — buyers failed at higher prices
- Long lower shadow, small body near the top
- After a downtrend — sellers were rejected from below
- No real body — open ≈ close ≈ low
- Same rally-and-rejection story, but as pure indecision
The Shooting Star is the one to watch out for. It's structurally identical to an Inverted Hammer — same small body, same long upper shadow — but it appears after an uptrend and signals the opposite: bearish reversal. Context decides the meaning.
The Hammer comparison matters too. Both appear after downtrends and signal potential reversals, but the Hammer shows sellers failing (rejection from below), while the Inverted Hammer shows buyers attempting (challenge from above). The Hammer is generally considered a clearer rejection signal, which is why confirmation is even more critical with the Inverted Hammer.
The Gravestone Doji looks almost identical to an Inverted Hammer — long upper shadow, close near the low — but the key difference is the body. An Inverted Hammer has a small but visible real body. A Gravestone Doji has essentially no body at all (open ≈ close ≈ low). Both can appear after a decline and both signal that buyers attempted to push higher — the distinction is structural, not directional.
A Hammer says "sellers lost." An Inverted Hammer says "buyers showed up." Same family, different level of conviction — and that difference changes how you trade it.
How to Trade the Inverted Hammer
The Inverted Hammer is trickier to trade than a regular Hammer because the candle itself closes near the low — it doesn't look bullish at first glance. That's why the process matters even more.
Make sure there's a real downtrend
Just like the Hammer, the Inverted Hammer only means something after a sustained decline — lower highs, lower lows, multiple sessions of selling. In a sideways range or after a shallow dip, the pattern has no context to reverse.
Check what's underneath it
The best Inverted Hammers form at levels where you'd expect buyers to step in: prior support, the 50-day or 200-day moving average, a Fibonacci retracement level, or a horizontal demand zone. If it forms in empty space, the buying attempt is more likely noise.
Wait for confirmation — it matters more here
An Inverted Hammer can be followed by brief consolidation, but it should show bullish follow-through within 1–3 candles. If price fails to break above the high with strength, the setup weakens.
Define your stop
The low of the Inverted Hammer is your invalidation line. If price closes below it, the buying attempt failed and sellers are still in control. Because the Inverted Hammer has little to no lower shadow, this stop is often tight — which means favorable risk-to-reward if the setup works.
You see an Inverted Hammer after a 2-week decline. It's at horizontal support with RSI near oversold. The next day's candle is small-bodied and inconclusive — not a clear bullish confirmation. The day after that is also a small candle. It's been three sessions since the Inverted Hammer with no clear move.
Has the setup failed? Should you move on?
Reading the Inverted Hammer in Context
Three lenses decide whether an Inverted Hammer is a real challenge to the downtrend or just a volatile candle: volume, structure, and momentum. Each gets its own dedicated guide; this is the quick orientation.
Volume — was the rally attempt fought or drifted into? An Inverted Hammer on heavy volume means real money showed up to push price higher — buyers committed capital, even though sellers eventually closed it back down. The same shape on light volume often means a few large orders briefly lifted a thin tape, with no genuine demand behind it. Pay particular attention to volume on the confirmation candle, too — above-average participation is what turns the rally attempt into a follow-through. Read the Candlesticks + Volume guide →
Structure — where on the chart did the rally attempt happen? An Inverted Hammer at the 50-day or 200-day moving average, a Fibonacci retracement, or prior horizontal support is buyers showing up where they've shown up before — the location does half the work. The same Inverted Hammer in open space, far from any level, is usually just a one-day volatility event with no structural anchor. Read the Candlesticks + Moving Averages guide →
Momentum — is the dominant side stretched or just resting? An Inverted Hammer while RSI is below 30 is the side that was pushing hard finally running out of fuel — the physics of the market favor a reversal, even if the close is ambiguous. Bullish RSI divergence (price makes a new low but RSI doesn't) makes the read stronger. An Inverted Hammer when RSI is mid-range often means the decline still has room to run. Read the Candlesticks + RSI guide →
Pattern tells me where to look, context tells me whether to act.
Seeing the Inverted Hammer in Action: $MMC
Here's an Inverted Hammer that played out — eventually, with the patience the candle demands.
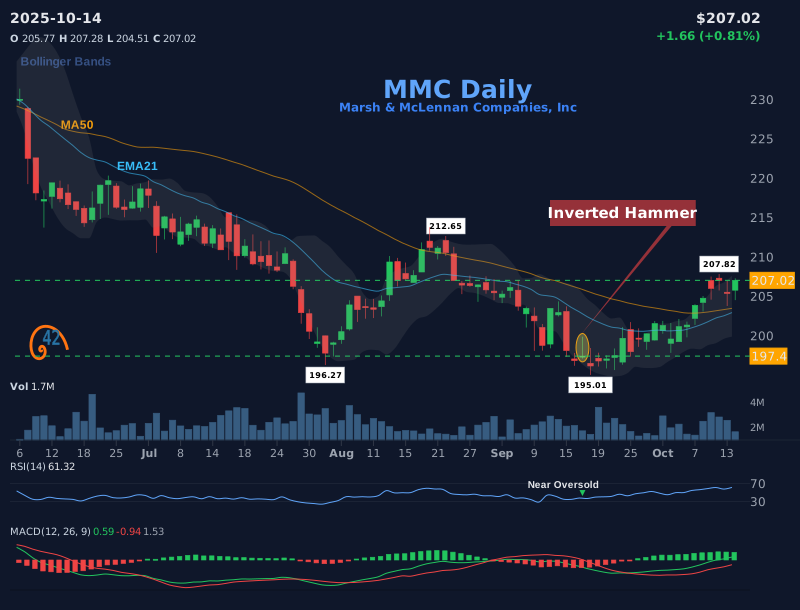
Before the Inverted Hammer. Marsh & McLennan ($MMC) had peaked near $212 in late August 2025. What followed was a steady, grinding decline — not a crash, but the kind of methodical selling that wears out bulls. Lower highs, lower closes, RSI working its way toward oversold. By mid-October the stock had dropped to the ~$195 area.
The Inverted Hammer prints. Right at horizontal support — a level where buyers had defended before — buyers pushed price hard during the session, leaving a long upper shadow. Sellers responded and closed the candle near the low. If you only looked at the close, nothing had happened. The upper shadow told a different story.
Consolidation follows. The next several sessions printed small-bodied candles — Spinning Top–like indecision, the kind of action that shakes out impatient traders. Crucially, the Inverted Hammer's low held through all of it. The thesis was alive while the market digested.
Confirmation arrives — delayed. On the fifth session after the Inverted Hammer, buyers finally asserted control with a decisive bullish close above the candle's high. That was the signal — late, but valid. From there $MMC rallied back toward the prior $212 peak through the rest of October.
Why this one was tradeable. Multi-week downtrend, horizontal support at the rally attempt, RSI near oversold, and — most importantly — a low that held through the digestion phase before confirmation arrived. The pattern's unique demand is patience; this one rewarded it.
Common Inverted Hammer Trading Mistakes
The Inverted Hammer is often misused because it closes near the low — it doesn't look bullish at first glance. Most mistakes come from either overestimating its strength or not understanding what the candle actually tells you.
See an Inverted Hammer, assume the bottom is in. Buy immediately.
The Inverted Hammer only shows that buyers challenged the downtrend. Without confirmation, sellers may still dominate. Wait for the next candle to close above the high.
The session after the Inverted Hammer isn't strongly bullish — clearly nothing is happening here. Move on.
Reversals that begin with an Inverted Hammer rarely snap to life in 24 hours. The indecision candles that follow are the market processing new information, not rejecting it. $MMC needed five sessions to resolve — as long as the low holds, the thesis is alive.
Any Inverted Hammer after a decline is tradeable — where on the chart it prints is a secondary detail.
An Inverted Hammer floating in empty chart space is a volatility event; the same candle pressing into MA support or a prior demand zone is a setup with a reason to exist. Price context changes what the candle means.
The low doesn't matter because there's barely any lower shadow.
That low is where sellers couldn't push below after buyers showed strength. A close below it means the buying attempt failed. Use it as your stop — it's often tight, which is an advantage.
The shape is all that matters. Volume is irrelevant.
Volume tells you whether the rally attempt had real participation. A long upper shadow on high volume means buyers showed up with conviction. Low volume means it could be noise.
- The Inverted Hammer shows buyers challenging a downtrend for the first time — not a reversal, but the first crack
- The long upper shadow is the story — buyers pushed higher, and even though sellers responded, they couldn't make new lows
- Confirmation matters more here than with a regular Hammer — the candle closes near the low, so the next session must prove buyers can follow through
- Expect delayed confirmation — consolidation before the reversal is normal, not a failure
- Don't confuse it with a Shooting Star — same shape after an uptrend means the opposite
- The session low is your stop — tight and well-defined, which gives favorable risk-to-reward
Frequently Asked Questions
What is an Inverted Hammer candlestick pattern?
An Inverted Hammer is a single-candle reversal pattern with a small body near the bottom of the range and a long upper shadow at least twice the body length. It appears after a downtrend and signals that buyers attempted to push price higher, though sellers closed it near the low.
How do you confirm an Inverted Hammer?
Wait for a subsequent candle to close above the Inverted Hammer's high. This may take more than one session — consolidation before confirmation is common with this pattern. A confirmation candle with above-average volume is stronger and more reliable than one on thin participation.
What is the difference between an Inverted Hammer and a Shooting Star?
They look identical — same small body near the bottom, same long upper shadow. The difference is context. An Inverted Hammer appears after a downtrend and is a bullish signal. A Shooting Star appears after an uptrend and is a bearish warning. Shape is the same, meaning is opposite.
What is the difference between an Inverted Hammer and a regular Hammer?
Both appear after downtrends and signal potential reversals. The Hammer has a long lower shadow (sellers failed to push lower), while the Inverted Hammer has a long upper shadow (buyers attempted to push higher). The Hammer is generally considered a clearer, stronger rejection signal of the two.
Where should I place my stop on an Inverted Hammer trade?
Below the Inverted Hammer's session low. Because the pattern has little to no lower shadow, this stop is often tight — which means favorable risk-to-reward if the setup works. Define this level before entering so you know exactly where the buying attempt has failed.
What is the difference between an Inverted Hammer and a Gravestone Doji?
Both have a long upper shadow and close near the low. The difference is the body. An Inverted Hammer has a small but visible real body. A Gravestone Doji has virtually no body (open, close, and low are nearly equal). Both signal a buying attempt that was pushed back.
Does the color of an Inverted Hammer matter?
Not much. A green (bullish) Inverted Hammer is slightly more encouraging because buyers closed above the open. But a red one still tells the same story — buyers challenged the downtrend and sellers couldn't make new lows. Shape, location, and confirmation matter far more than color.
Why does the Inverted Hammer often have delayed confirmation?
Because the candle closes near its low, the signal is more ambiguous than a Hammer. It often takes several sessions of consolidation (small-bodied candles, Spinning Tops) for buyers and sellers to resolve the indecision before a clear follow-through develops. Patience is part of the setup.
The Bottom Line
The Inverted Hammer teaches you something most patterns don't: the most important signals don't always look the way you expect them to.
A candle that closes near the low after a downtrend doesn't scream "buy." It doesn't look like a reversal. But the long upper shadow — that rally attempt that came from nowhere — is the market telling you something has changed. Buyers exist again. And that's worth paying attention to.
The traders who benefit from the Inverted Hammer are the ones who can read past the surface, wait through consolidation without panicking, and enter when confirmation actually arrives — even if it takes five sessions. That patience is the edge.
Our 42Fibonacci Scanner checks for these conditions automatically across 3,000+ stocks.
Find Inverted Hammer setups in the scanner →In this guide
'%3e%3crect%20width='240'%20height='240'%20fill='%23FF7A00'%3e%3c/rect%3e%3cg%20transform='matrix(0.07095%200%200%20-0.07095%2015%20220.748)'%20fill='%23FFFFFF'%20stroke='none'%3e%3cpath%20d='M1365%202583%20c-628%20-81%20-1087%20-602%20-1111%20-1258%20-9%20-231%2023%20-399%20111%20-580%20207%20-427%20651%20-631%20900%20-414%20313%20274%2067%20875%20-305%20744%20-177%20-63%20-242%20-307%20-110%20-418%2098%20-83%20230%20-43%20230%2069%200%2047%20-5%2051%20-34%2029%20-55%20-42%20-117%204%20-100%2073%2020%2082%20131%20108%20196%2046%2074%20-71%20100%20-207%2058%20-316%20-65%20-174%20-281%20-266%20-437%20-185%20-146%2075%20-276%20272%20-340%20515%20-34%20128%20-39%20396%20-10%20532%20103%20479%20422%20837%20856%20958%20143%2040%20402%2039%20536%20-1%20434%20-132%20743%20-484%20841%20-959%2019%20-91%2024%20-295%2011%20-413%20-11%20-91%20-2%20-80%2029%2041%2080%20312%2017%20689%20-163%20972%20-253%20397%20-715%20623%20-1158%20565z'%3e%3c/path%3e%3cpath%20d='M2035%201809%20c-63%20-18%20-121%20-85%20-140%20-161%20-6%20-23%20-3%20-27%2027%20-33%2018%20-3%2040%20-9%2050%20-11%2011%20-3%2018%203%2023%2023%2025%20113%20189%20126%20225%2018%2031%20-93%20-7%20-155%20-243%20-409%20-86%20-92%20-88%20-96%20-85%20-138%20l3%20-43%20223%20-2%20222%20-3%200%2045%20c0%2025%20-1%2048%20-2%2053%20-3%207%20-22%208%20-191%2011%20l-98%201%2075%2083%20c167%20181%20210%20263%20204%20379%20-8%20148%20-140%20232%20-293%20187z'%3e%3c/path%3e%3cpath%20d='M1579%201733%20c-29%20-43%20-106%20-154%20-171%20-247%20-107%20-152%20-118%20-173%20-118%20-212%20l0%20-44%20173%20-2%20172%20-3%203%20-88%203%20-89%2052%204%20c32%202%2052%208%2053%2016%201%206%202%2046%203%2087%20l1%2075%2045%200%2045%200%200%2050%200%2050%20-45%200%20-45%200%20-1%20173%20c-1%2094%200%20202%201%20240%20l2%2067%20-60%200%20-60%200%20-53%20-77z%20m58%20-400%20c-3%20-2%20-52%20-2%20-110%20-1%20l-105%203%20107%20155%20106%20155%203%20-154%20c1%20-85%201%20-156%20-1%20-158z'%3e%3c/path%3e%3c/g%3e%3c/g%3e%3c/svg%3e)
42Fibonacci