Picture this: a stock has been falling for two weeks. Every session, sellers push it lower. Stops get triggered. Traders who bought the dip last week are underwater. The chart looks ugly.
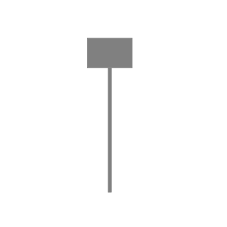
Then one day, something different happens. Price drops hard in the morning — but by the close, it's recovered almost everything. The candle left behind has a tiny body near the top and a long shadow stretching down below.
That candle is a Hammer. And it might be the most important candle on the chart.
Sellers pushed price down. Buyers pushed it right back up. That battle — in one candle — is the Hammer.
What Makes a Hammer
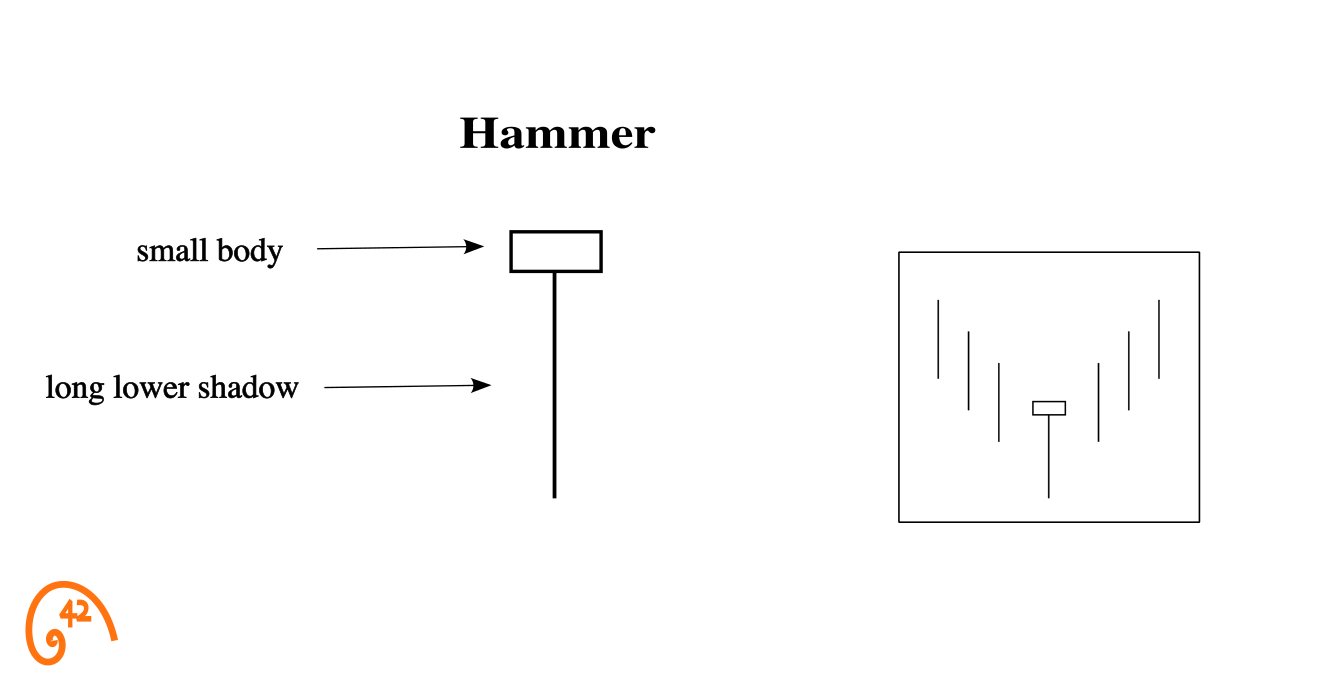
The Hammer is a single-candle pattern defined by its shape: a small real body near the top of the range and a long lower shadow — at least twice the body length.
The name comes from exactly what it looks like: a small head sitting on a long handle, like a hammer striking the ground. The metaphor fits — the market is trying to hammer out a bottom.
How a Hammer Forms
Every candlestick is a compressed story. The Hammer's story is about a power shift that happens in a single session. Here's what's actually going on:
"Another red day. Stops are getting hit. No reason to buy yet."
The session opens and sellers immediately take control. Price drops, continuing the decline from previous days. Bears are confident. Longs are panicking.
"Wait — it's holding. Someone is buying down here."
At some point during the session, buying pressure appears. Maybe at support, maybe at a round number. Each push lower gets absorbed. The decline stalls.
"They're covering. Price is climbing back. The bears lost this one."
Buyers push back with force. Price climbs back toward the open. Short sellers cover. By the close, almost all of the decline has been erased. The long lower shadow is what's left — the scar of a battle the bears lost.
Here's what many traders get wrong: the Hammer doesn't mean buyers have taken over. It means bears lost their grip — for one session. That's the first crack in a downtrend, not the reversal itself.
Whether that crack turns into something bigger depends entirely on what happens next. Think of the Hammer as a question, not an answer: "Are sellers still in control?" The next candle provides the answer.
Hammer vs. Lookalikes
The Hammer has siblings that look almost identical but carry completely different messages. Confusing them is one of the most common mistakes in candlestick analysis. The difference isn't the shape — it's the context.
- Long lower shadow, small body near top
- After a downtrend — buyers rejected the low
- Identical shape to a Hammer
- After an uptrend — buyers couldn't hold it
- Long upper shadow, small body near bottom
- After a downtrend — buyers tried, then gave back
- No real body — open ≈ close ≈ high
- Same rejection story, but as pure indecision
Same candle shape, opposite signals — entirely because of where they appear. A Hammer at the bottom of a decline is bullish. The exact same shape at the top of a rally is a Hanging Man, and it's bearish. Context is everything.
The Hanging Man is the same physical shape as the Hammer — long lower shadow, small body near the top — but it appears after an uptrend instead of a downtrend. Buyers had been in control, then sellers pushed price down and buyers couldn't fully reclaim it. It's a bearish warning where the Hammer is a bullish reversal — same candle, opposite read.
The Dragonfly Doji is the one that trips people up the most. It looks almost identical to a Hammer — long lower shadow, close near the high — but the key difference is the body. A Hammer has a small but visible real body. A Dragonfly has essentially no body at all (open ≈ close ≈ high). Both signal sellers were rejected; the Hammer leans directional, the Dragonfly leans indecisive.
The Inverted Hammer is the mirror — same downtrend setup, but the long upper shadow signals buyers' first real attempt to overtake the sellers. The push didn't hold this session, but it's the first time bulls challenged the trend.
A pattern without context is just a shape. A shape in the right place is a signal.
How to Trade the Hammer
The Hammer is one of the most recognized patterns in trading — and one of the most misused. Here's the difference between how beginners trade it and how experienced traders trade it.
Make sure there's a real downtrend
This is the most common mistake. A Hammer only means something after a sustained decline — lower highs, lower lows, multiple sessions of selling. A Hammer inside a range or after a two-day dip is just a candle with a long wick. No downtrend, no reversal signal.
Check what's underneath it
The best Hammers don't appear at random prices. They form at levels where you'd expect buyers to show up: prior support, the 50-day or 200-day moving average, a Fibonacci retracement level, or the bottom of a well-defined channel. If the Hammer forms in empty space with no nearby structure, it's probably just volatility.
Don't buy the Hammer — buy the confirmation
This is where patience pays. The Hammer itself is just a warning signal. Your actual entry comes when the next candle closes above the Hammer's high. That close is what tells you buyers are actually following through, not just covering shorts for one session. Bonus: if that confirmation candle comes with above-average volume, the signal is significantly stronger.
Know exactly where you're wrong
Before you enter, define your stop. The low of the Hammer is the natural invalidation point. If price closes below it, the rejection failed and sellers are still in control. No ambiguity, no hoping — a close below the Hammer low means the setup is dead. This is what separates a trade from a gamble.
A stock has been declining for 3 weeks. Today it drops hard in the morning but recovers to close near the high, leaving a long lower shadow. The candle looks like a Hammer. But it formed in the middle of the range — far from any moving average or prior support level. Volume is below average.
Do you act on this Hammer?
Reading the Hammer in Context
Three lenses decide whether a Hammer is a real rejection or just a volatile candle: volume, structure, and momentum. Each gets its own dedicated guide; this is the quick orientation.
Volume — was the rejection fought or drifted into? A Hammer on heavy volume means real money showed up to defend the low — buyers absorbed every contract sellers threw at them. The strongest version is heavy volume on the selloff that dries up as price recovers: bears used up their ammunition and couldn't hold the low. A Hammer on light volume is just an empty wick. Read the Candlesticks + Volume guide →
Structure — where on the chart did the Hammer form? A Hammer at the 50-day or 200-day moving average, a Fibonacci retracement, or prior horizontal support is forming where buyers have shown up before — the location does half the work. A Hammer in empty space, far from any level, is probably just intraday volatility. Read the Candlesticks + Moving Averages guide →
Momentum — is selling stretched or just resting? A Hammer when RSI is below 30 is the side that was pushing hard finally running out of fuel — the reversal has physics behind it, not just hope. A Hammer when RSI is mid-range often means the decline still has room to run. Read the Candlesticks + RSI guide →
Pattern tells you where to look, context tells you whether to act.
Seeing the Hammer in Action: $RKLB
Here's a Hammer that passed every filter — the kind of setup the pattern is actually designed to flag.
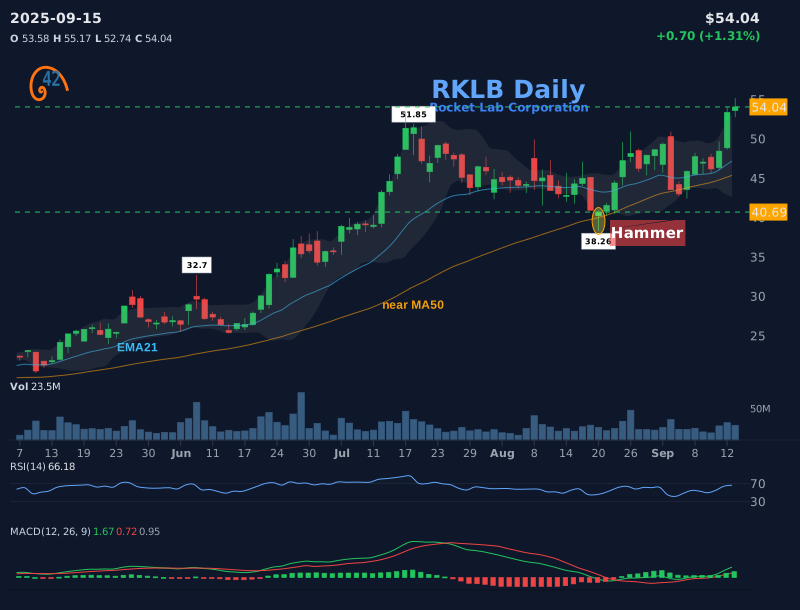
Before the Hammer. Rocket Lab ($RKLB) had run hard into a July 2025 peak near $51.85, then started grinding lower — lower highs, lower closes, steady distribution. By mid-August the stock had given back more than 20% from the high and was sitting right on the 50-day moving average.
The Hammer prints. Sellers pushed price below the 50-day MA intraday — the kind of break that usually triggers stops. But by the close, buyers had reclaimed nearly all of it. The candle settled near $40.69, leaving a long lower shadow stretching down through the MA. The break failed; the level held.
The next session. Price closed above the Hammer's high. That's the confirmation: buyers didn't just defend the low, they followed through. From there, the bounce ran back toward the prior peak over the following weeks.
Why this one was tradeable. Real downtrend (multi-week decline, not a two-day dip), structural level (50-day MA, the most-watched dynamic support), strong lower shadow (clean rejection through the MA and back), and next-session follow-through. Four boxes checked before the entry.
Common Hammer Trading Mistakes
The Hammer is simple to identify and easy to misuse. Most failed Hammer trades don't fail because the pattern was wrong — they fail because the trader skipped a step.
See a Hammer, buy immediately. The candle is the signal — why wait?
Wait for confirmation. Enter only after the next candle closes above the Hammer's high. That close proves buyers actually followed through.
If the candle looks like a Hammer, it counts — in a chop zone, at the top of a bounce, two days into a shallow pullback. Shape is shape.
Shape without trend context is just a candle with a long wick. The Hammer derives its meaning from what it interrupts; if there's no real selling pressure to reject, the rejection communicates nothing.
Any candle with a long lower wick counts. Close enough is good enough.
The body must be small and near the top of the range. A large body or a close in the lower half is just a wide-range candle, not a rejection.
At 2:30pm the candle looks like a Hammer — good enough, enter now.
Wait for the session to close. A candle that looks like a Hammer at 2:30 can turn into something completely different by 4:00.
The shape is all that matters. Volume is just noise.
Volume validates the rejection. A Hammer on high volume means real money defended that level. Low volume means it could be random.
- A Hammer is the first crack in bearish control — not a guaranteed reversal, but a reason to pay attention
- The lower shadow is the story — the longer it is, the harder buyers fought back
- Context matters more than shape — a Hammer at support with volume carries far more weight than one in empty space
- Don't confuse it with a Hanging Man — same shape, but after an uptrend it's a bearish signal
- Volume separates real rejections from noise — above-average participation means real money defended that level
- Always wait for confirmation: the next candle needs to close above the Hammer's high before you act
- If the Hammer's low breaks, the setup is dead — define that as your stop before entering
Frequently Asked Questions
What is a Hammer candlestick pattern?
A Hammer is a single-candle reversal pattern with a small body near the top of the range and a long lower shadow at least twice the body length. It appears after a downtrend and signals that sellers pushed price down but buyers recovered almost everything by the close.
How do you confirm a Hammer candlestick?
Wait for the next candle to close above the Hammer's high. That close proves buyers actually followed through — not just short covering for one session. A confirmation candle with above-average volume is significantly stronger and more reliable to trade on than one on thin participation.
What is the difference between a Hammer and a Hanging Man?
They look identical — same small body, same long lower shadow. The difference is context. A Hammer appears after a downtrend and is a bullish reversal signal. A Hanging Man appears after an uptrend and is a bearish warning. Same shape, opposite meaning depending on where it forms.
Where should I place my stop loss on a Hammer trade?
Below the Hammer's low. That's the natural invalidation point — if price breaks below it, the rejection failed and sellers are still in control. Define this level before you enter the trade so you know exactly where the setup is wrong, with no ambiguity.
What is the difference between a Hammer and a Dragonfly Doji?
They look very similar — both have a long lower shadow and close near the high. The difference is the body. A Hammer has a small but visible real body. A Dragonfly Doji has virtually no body (open, close, and high are nearly equal). Both signal seller rejection — the distinction is structural.
Does the color of a Hammer candlestick matter?
Not much. A green (bullish) Hammer is slightly stronger because buyers closed above the open, but a red Hammer still shows the same rejection of lower prices. Focus on the shape, the shadow length, and the context — not the color. Location and confirmation matter far more.
How reliable is the Hammer pattern?
Reliability depends entirely on context. A Hammer after a sustained downtrend, at a key support level, with above-average volume and followed by a confirmation candle is significantly more reliable than a Hammer in a sideways range with no supporting conditions underneath it.
The Bottom Line
The Hammer is the market's way of saying: "Sellers tried. They failed."
It doesn't promise a reversal. It doesn't guarantee profits. What it does is mark the exact session where bearish momentum broke down — and that's valuable information.
When you see a Hammer after a clear decline, at a meaningful support level, followed by a confirmation candle with conviction — you're looking at one of the most reliable setups in candlestick analysis. Not because the pattern is magic, but because you've stacked enough context to give yourself a genuine edge.
Our 42Fibonacci Scanner checks for these conditions automatically across 3,000+ stocks.
Find Hammer setups in the scanner →In this guide
'%3e%3crect%20width='240'%20height='240'%20fill='%23FF7A00'%3e%3c/rect%3e%3cg%20transform='matrix(0.07095%200%200%20-0.07095%2015%20220.748)'%20fill='%23FFFFFF'%20stroke='none'%3e%3cpath%20d='M1365%202583%20c-628%20-81%20-1087%20-602%20-1111%20-1258%20-9%20-231%2023%20-399%20111%20-580%20207%20-427%20651%20-631%20900%20-414%20313%20274%2067%20875%20-305%20744%20-177%20-63%20-242%20-307%20-110%20-418%2098%20-83%20230%20-43%20230%2069%200%2047%20-5%2051%20-34%2029%20-55%20-42%20-117%204%20-100%2073%2020%2082%20131%20108%20196%2046%2074%20-71%20100%20-207%2058%20-316%20-65%20-174%20-281%20-266%20-437%20-185%20-146%2075%20-276%20272%20-340%20515%20-34%20128%20-39%20396%20-10%20532%20103%20479%20422%20837%20856%20958%20143%2040%20402%2039%20536%20-1%20434%20-132%20743%20-484%20841%20-959%2019%20-91%2024%20-295%2011%20-413%20-11%20-91%20-2%20-80%2029%2041%2080%20312%2017%20689%20-163%20972%20-253%20397%20-715%20623%20-1158%20565z'%3e%3c/path%3e%3cpath%20d='M2035%201809%20c-63%20-18%20-121%20-85%20-140%20-161%20-6%20-23%20-3%20-27%2027%20-33%2018%20-3%2040%20-9%2050%20-11%2011%20-3%2018%203%2023%2023%2025%20113%20189%20126%20225%2018%2031%20-93%20-7%20-155%20-243%20-409%20-86%20-92%20-88%20-96%20-85%20-138%20l3%20-43%20223%20-2%20222%20-3%200%2045%20c0%2025%20-1%2048%20-2%2053%20-3%207%20-22%208%20-191%2011%20l-98%201%2075%2083%20c167%20181%20210%20263%20204%20379%20-8%20148%20-140%20232%20-293%20187z'%3e%3c/path%3e%3cpath%20d='M1579%201733%20c-29%20-43%20-106%20-154%20-171%20-247%20-107%20-152%20-118%20-173%20-118%20-212%20l0%20-44%20173%20-2%20172%20-3%203%20-88%203%20-89%2052%204%20c32%202%2052%208%2053%2016%201%206%202%2046%203%2087%20l1%2075%2045%200%2045%200%200%2050%200%2050%20-45%200%20-45%200%20-1%20173%20c-1%2094%200%20202%201%20240%20l2%2067%20-60%200%20-60%200%20-53%20-77z%20m58%20-400%20c-3%20-2%20-52%20-2%20-110%20-1%20l-105%203%20107%20155%20106%20155%203%20-154%20c1%20-85%201%20-156%20-1%20-158z'%3e%3c/path%3e%3c/g%3e%3c/g%3e%3c/svg%3e)
42Fibonacci