
Candlesticks + RSI: Timing Exhaustion
See live examples in scanner →A stock sells off hard for three weeks. RSI drops under 30. Then a Hammer prints. Without the RSI context, that's just another rejection candle in a falling stock. With RSI below 30 after a sustained decline, it's a rejection candle appearing exactly when sellers may be running out of fuel.
That's what RSI measures: how stretched the move is.
Overbought isn't a sell signal. Oversold isn't a buy signal. RSI doesn't tell you where price is going — it tells you how hard the market pushed to get here, and whether that push is running out of fuel.
RSI doesn't tell you where price is going. It tells you how hard the market pushed to get here — and whether that push is fading.
What Is RSI
RSI — Relative Strength Index — is a momentum oscillator that measures the speed and magnitude of recent price changes. It was developed by J. Welles Wilder in 1978, and it remains one of the most widely used technical indicators for a simple reason: it answers a question that price alone cannot.
The question: How aggressive has the recent buying or selling been, relative to the stock's own recent history?
Conceptually, RSI compares the average size of recent up-closes to the average size of recent down-closes over a lookback period — typically 14 sessions. When up-closes have been consistently larger than down-closes, RSI rises. When down-closes dominate, RSI falls.
The result is a number between 0 and 100. That number doesn't tell you anything about direction. It tells you about intensity — how one-sided the recent momentum has been.
What RSI Does and Doesn't Do
This is where most traders go wrong with RSI, so let's be precise about what this indicator actually provides — and what it doesn't.
RSI measures momentum exhaustion. When RSI reaches extreme levels, it's telling you that the recent move has been unusually one-sided. That's a description of what has happened, not a prediction of what will happen next.
RSI does not tell you when a reversal will happen, how far price will move, whether the current trend is about to end, or whether you should buy or sell right now.
What RSI does tell you is how stretched the current move is relative to recent history, whether buying or selling pressure has been unusually one-sided, and whether a candlestick pattern is forming in a stretched or balanced environment.
That last point is the key for candlestick traders. RSI doesn't replace pattern analysis — it adds a layer of context that helps you evaluate whether a pattern is forming in conditions where a shift is mechanically more plausible.
The 70/30 Levels
Every RSI tutorial mentions 70 and 30. Most get the interpretation wrong.
RSI above 70 does not mean "sell." It means buying pressure has been dominant and the move is stretched. In strong uptrends, RSI can stay above 70 for weeks or even months. Selling because RSI hit 70 in a strong trend is one of the most common ways traders get run over.
RSI below 30 does not mean "buy." It means selling pressure has been dominant and the decline is stretched. In severe downtrends, RSI can stay below 30 for extended periods while price continues to fall.
What these levels actually mean is simpler and more useful than "buy" or "sell": below 30 says selling has been aggressive enough that the move is stretched — a bullish pattern there carries more weight than one at RSI 50. Above 70 says buying has been aggressive enough that the move is stretched — a bearish pattern there carries more weight than one at RSI 50. Between 40 and 60 momentum is not extreme in either direction; patterns in that zone need other context layers (volume, structure) to carry weight.
Read the level as a description, not a command
RSI below 30 means "selling has been aggressive." It does not mean "start buying." The difference between those two interpretations is where most RSI-related losses come from.
Check how long RSI has been at the extreme
RSI that drops below 30 for one session and bounces back is different from RSI that has been camped below 30 for two weeks. Duration matters — longer extremes mean more sustained pressure, which can mean either deeper exhaustion or a genuinely broken trend.
Look for the candlestick pattern, not just the RSI reading
RSI at 25 with no reversal pattern is just a stretched market getting more stretched. RSI at 25 with a Hammer at support is a setup where multiple layers of context align. The RSI creates the environment — the pattern creates the signal.
RSI Below 30: When Selling Runs Out of Fuel
When RSI drops below 30, the market is telling you something specific: recent selling has been so dominant that down-closes have overwhelmed up-closes over the lookback period. That's a measurable condition, not an opinion.
For candlestick traders, this changes the context around bullish patterns. A Hammer forming at RSI 48 is a rejection candle in a neutral momentum environment. The same Hammer forming at RSI 25 is a rejection candle appearing after selling has been relentless — where the sellers may be running out of participants willing to sell lower.
The pattern is the same. The context is not. And that context difference is what separates a candle worth watching from a candle worth acting on.
But — and this is critical — oversold does not mean "done selling." Stocks can go from RSI 28 to RSI 15. Markets can stay oversold for weeks in capitulation events. The RSI reading adds weight to bullish patterns; it does not replace the need for confirmation. A Hammer at RSI 25 still needs the next candle to close above its high before it's a trade.
RSI Above 70: When Strength Becomes Stretched
RSI above 70 is where more traders lose money than any other RSI condition. Here's why: they see "overbought" and they hear "sell." But overbought in a strong uptrend is just the market doing what strong uptrends do — going up aggressively.
The most important thing to understand about RSI above 70 is that it describes the character of the move, not its endpoint. A stock that rallies from $50 to $80 in three weeks will have RSI well above 70. That doesn't mean the rally is over — it means the rally has been strong.
Where RSI above 70 becomes useful for candlestick traders is when bearish patterns start appearing. A Doji at RSI 55 is indecision in a neutral environment. A Doji at RSI 78 is indecision after an aggressive rally — the first sign that the buyers who have been in control might be losing their grip.
The overbought reading doesn't make the Doji bearish by itself. But it tells you the Doji is forming in a stretched environment where the buying pressure has been unusually one-sided. That's meaningful context.
Pattern tells me where to look, context tells me whether to act.
Real Example: Bullish Harami in Oversold $LLY
Here's a Bullish Harami on Eli Lilly ($LLY) that printed exactly where the RSI context said the selling might be running out — with the indicator camped below 30 after a sustained decline.
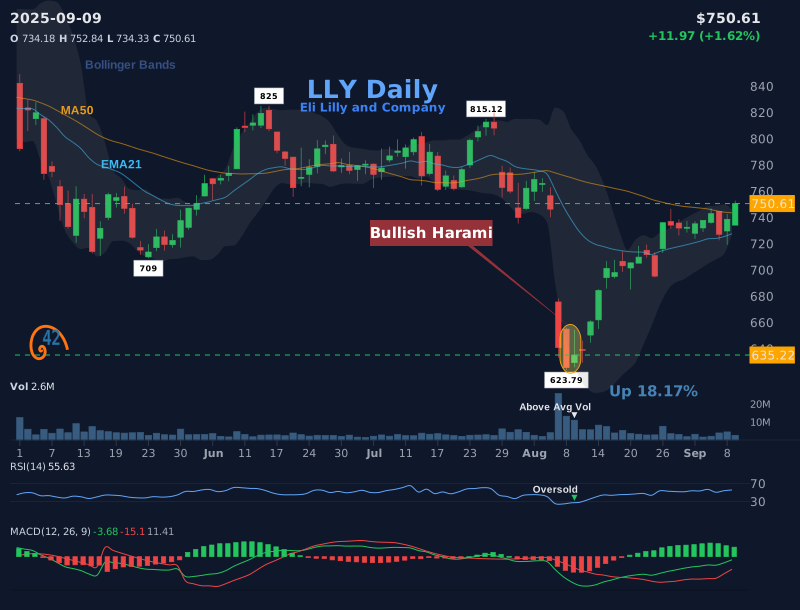
Before the Harami. $LLY had been falling steadily heading into the print. The drop wasn't a one-day shock — it was sustained, session after session, with each rally attempt failing. RSI had moved into oversold territory and stayed there for multiple sessions. Selling pressure wasn't just present; it had been one-sided enough to push the indicator below 30 and keep it there.
The pattern prints. On August 9, 2025, a Bullish Harami formed. The first candle continued the decline with a strong red close; the second sat entirely inside its body — a small candle that said the sellers had finally stopped pressing.
What RSI context added. The same Harami at RSI 50 is a routine indecision-after-pullback signal. The Harami with RSI camped below 30 for several sessions is the same shape forming in an environment where the selling has already been stretched — exhaustion as the backdrop, not just a pause.
Why this one was tradeable. Sustained prior decline, RSI below 30 for multiple sessions before the print (not a one-session dip), a recognized reversal pattern at the right place, and follow-through in the days after — price stabilized, sessions moved higher, and RSI gradually recovered toward the middle of its range. Strip any of those conditions and the setup weakens.
A stock's RSI drops to 25. A Doji forms. Someone tells you 'RSI is oversold, time to buy.'
What's wrong with this reasoning?
Common RSI Mistakes
RSI is one of the most intuitive indicators — and that simplicity is exactly what makes it dangerous. Most RSI mistakes come from treating a context tool as a signal generator.
The indicator flipped into the shaded zone — that's all I need to click buy.
An oversold print describes the flavor of recent trading; it doesn't nominate a specific moment to enter. You still need a candle that says "right here, at this price, sellers paused." Without that anchor, you're buying a mood.
RSI hit 75 — this stock is way too high. Time to short.
Strong uptrends routinely keep RSI above 70 for weeks. Overbought is a description of momentum, not a reversal signal. Shorting into trend strength based on RSI alone is how traders get run over.
Numbers first, candles second — the oscillator will tell me everything.
The oscillator is a weather report; the chart is the street outside. You use one to know what to expect and the other to actually act. Skipping the candle means entering with a vibe instead of a defined invalidation point. Both are required.
It has been sub-30 for days now — the bounce is mathematically due.
Nothing in the formula enforces reversion. In real downtrends the reading can sit at the floor for weeks while the stock keeps sliding; in parabolic rallies the opposite. Time spent at an extreme tells you the move is intense, not that the clock is about to run out.
RSI just crossed above 50 — that's a bullish signal!
RSI 50 is the mathematical midpoint of the scale. It's not a support level, a resistance level, or a signal. It's just the middle. Don't assign meaning to a number that has none.
- RSI measures momentum intensity — how one-sided recent buying or selling has been
- Oversold (below 30) and overbought (above 70) describe conditions, not commands to buy or sell
- RSI adds context to candlestick patterns — it tells you whether a pattern is forming in a stretched or neutral environment
- Bullish patterns in oversold conditions carry more weight because the selling pressure is already stretched
- RSI can stay at extremes for extended periods — there is no rule that forces reversion
- RSI without a candlestick pattern is just a number — context without a signal is not a trade
- RSI 14 on daily charts is the standard — changing the lookback without a specific reason removes the consensus that makes the levels meaningful
Frequently Asked Questions
What is RSI in trading?
RSI (Relative Strength Index) is a momentum oscillator that measures how aggressive recent buying or selling has been relative to a stock's own recent history. It produces a number between 0 and 100, with readings below 30 indicating stretched selling and readings above 70 indicating stretched buying pressure.
Does RSI below 30 mean I should buy?
No. RSI below 30 means selling has been unusually aggressive — it doesn't mean selling is over. It adds context to bullish candlestick patterns (making them more meaningful), but it is not a buy signal on its own. You still need a pattern, confirmation, and a defined risk plan.
Can RSI stay overbought or oversold for a long time?
Yes. In strong trends, RSI can remain above 70 or below 30 for weeks. There is no rule that forces RSI to revert to the middle. Assuming that extreme readings must reverse quickly is one of the most common RSI-related mistakes — strong trends routinely hold extreme readings.
What RSI period should I use?
RSI 14 (the default) is the standard for daily charts and what most market participants watch. Using the same setting as the majority creates a self-reinforcing consensus around the key levels. Changing the lookback without a specific reason removes that consensus advantage without gaining meaningful signal quality.
How does RSI work with candlestick patterns?
RSI provides context about the momentum environment. A bullish pattern forming while RSI is oversold is more meaningful because selling pressure is already stretched. A bearish pattern forming while RSI is overbought is more meaningful because buying is stretched. RSI doesn't change the pattern — it changes the environment around it.
Is RSI 50 a meaningful level?
No. RSI 50 is the mathematical midpoint of the 0-100 scale. It's not a support level, a resistance level, or a signal. The meaningful RSI levels are the extremes — below 30 and above 70 — where momentum has been unusually one-sided. Assigning meaning to RSI 50 is a common mistake.
The Bottom Line
RSI doesn't make patterns work. It helps you understand when they're more likely to breathe — and when they're fighting the current.
When you see a candlestick pattern forming and you check RSI, you're asking a simple question: "Has the recent move been stretched enough that a shift is mechanically plausible?" If RSI is at an extreme, the answer is "more so than usual." If RSI is in the middle, the answer is "not from a momentum standpoint — check other context layers."
That's all RSI does. And that's enough to meaningfully change how you evaluate every candlestick pattern you encounter.
Our 42Fibonacci Scanner surfaces RSI context directly alongside every candlestick setup — so you can see momentum conditions at a glance instead of checking manually.
See RSI context in the scanner →In this guide
'%3e%3crect%20width='240'%20height='240'%20fill='%23FF7A00'%3e%3c/rect%3e%3cg%20transform='matrix(0.07095%200%200%20-0.07095%2015%20220.748)'%20fill='%23FFFFFF'%20stroke='none'%3e%3cpath%20d='M1365%202583%20c-628%20-81%20-1087%20-602%20-1111%20-1258%20-9%20-231%2023%20-399%20111%20-580%20207%20-427%20651%20-631%20900%20-414%20313%20274%2067%20875%20-305%20744%20-177%20-63%20-242%20-307%20-110%20-418%2098%20-83%20230%20-43%20230%2069%200%2047%20-5%2051%20-34%2029%20-55%20-42%20-117%204%20-100%2073%2020%2082%20131%20108%20196%2046%2074%20-71%20100%20-207%2058%20-316%20-65%20-174%20-281%20-266%20-437%20-185%20-146%2075%20-276%20272%20-340%20515%20-34%20128%20-39%20396%20-10%20532%20103%20479%20422%20837%20856%20958%20143%2040%20402%2039%20536%20-1%20434%20-132%20743%20-484%20841%20-959%2019%20-91%2024%20-295%2011%20-413%20-11%20-91%20-2%20-80%2029%2041%2080%20312%2017%20689%20-163%20972%20-253%20397%20-715%20623%20-1158%20565z'%3e%3c/path%3e%3cpath%20d='M2035%201809%20c-63%20-18%20-121%20-85%20-140%20-161%20-6%20-23%20-3%20-27%2027%20-33%2018%20-3%2040%20-9%2050%20-11%2011%20-3%2018%203%2023%2023%2025%20113%20189%20126%20225%2018%2031%20-93%20-7%20-155%20-243%20-409%20-86%20-92%20-88%20-96%20-85%20-138%20l3%20-43%20223%20-2%20222%20-3%200%2045%20c0%2025%20-1%2048%20-2%2053%20-3%207%20-22%208%20-191%2011%20l-98%201%2075%2083%20c167%20181%20210%20263%20204%20379%20-8%20148%20-140%20232%20-293%20187z'%3e%3c/path%3e%3cpath%20d='M1579%201733%20c-29%20-43%20-106%20-154%20-171%20-247%20-107%20-152%20-118%20-173%20-118%20-212%20l0%20-44%20173%20-2%20172%20-3%203%20-88%203%20-89%2052%204%20c32%202%2052%208%2053%2016%201%206%202%2046%203%2087%20l1%2075%2045%200%2045%200%200%2050%200%2050%20-45%200%20-45%200%20-1%20173%20c-1%2094%200%20202%201%20240%20l2%2067%20-60%200%20-60%200%20-53%20-77z%20m58%20-400%20c-3%20-2%20-52%20-2%20-110%20-1%20l-105%203%20107%20155%20106%20155%203%20-154%20c1%20-85%201%20-156%20-1%20-158z'%3e%3c/path%3e%3c/g%3e%3c/g%3e%3c/svg%3e)
42Fibonacci